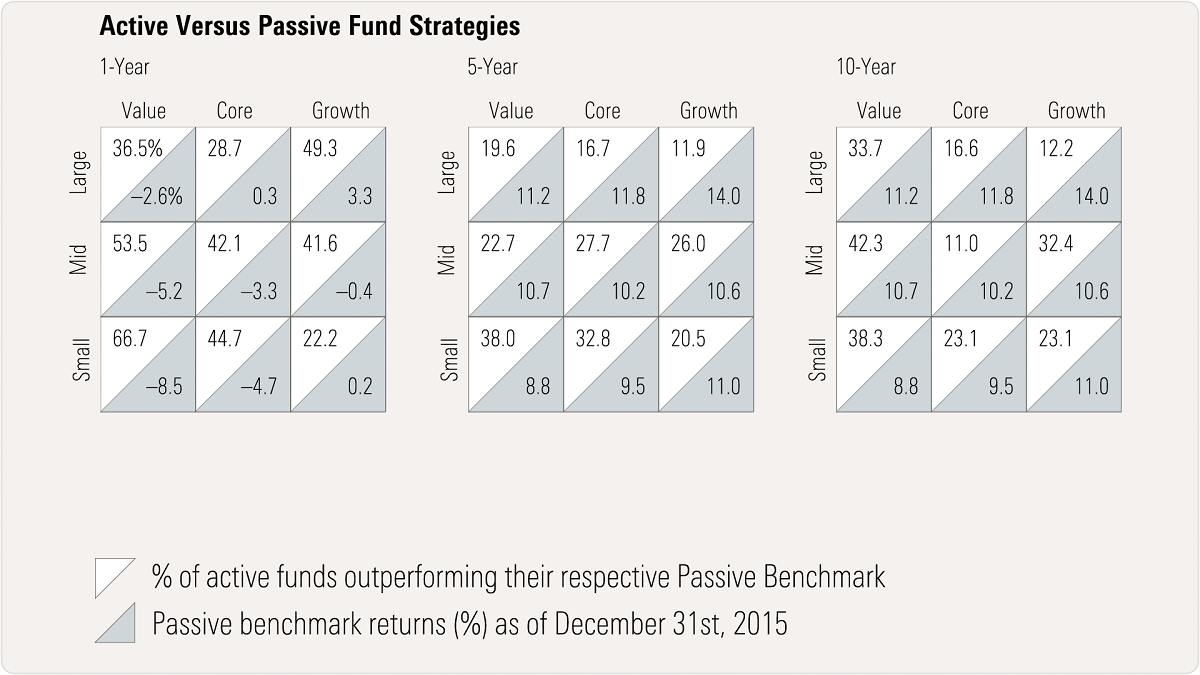
The above chart, Morningstar's Active/Passive Barometer, measures active-manager success. For instance, it compares active managers' returns against a composite made up of relevant passive index funds. It reflects the actual net-of-fee performance of passive funds rather than an index, which isn't investable. It assesses active funds based on their beginning-of-period category classification so as to replicate the opportunity set an investor could have chosen from at the time.
The chart looks at 1-, 5-, and ten-year periods for U.S. equity funds. In each box, there are two numbers. The top number is the percentage of active funds that outperformed the passive benchmark. The bottom number is the return of the passive benchmark over the period.
In the long run, active funds underperform their passive counterparts due to higher fees and trading costs - only two style boxes had a success rate of more than 50% for any period. In general, the 1-year success rate is more volatile than the 10-year success rate. Over any short-term period, active managers will have a wide range of returns, which can lead to strong outperformance or underperformance versus the passive benchmark. Also, there is a correlation between success rate and performance of the category. Over the last year, the small-value style box has had the worst performance, but it has the highest success rate. This is because most active managers don't only hold small-value stocks in their portfolio; they likely has some mid-value and small core stocks, which helps the active manager outperform when small value has a bad year.
This analysis shows that, on average, active managers underperform. This doesn't mean that active management doesn't have a place in portfolio but investors needs to look to other factors such as management fees, stewardship, and investment process to find the best active funds.