


Global financial markets continued to claw back from their coronavirus-crisis lows in May 2020. At month-end, the Morningstar Global Markets Index--a broad gauge of global stock markets--had rebounded 40% from its recent low and sat just 12% below its mid-February peak. Fixed-income markets have also normalized. The Morningstar US Core Bond Index was within spitting distance of its nearby highs as of the end of May. Here, I will take a closer look at how the major asset classes performed, where investors were putting their money, and whether there are bargains left after markets have bounced back--all through the lens of exchange-traded funds.
Broad-Based Gains
May's gains were widespread. Of the 2,133 nonleveraged exchange-traded products in Morningstar's U.S. database, just 140 (6.5%) posted losses for the month. Prominent among the losers were ETFs that invest Hong Kong stocks. The Hong Kong market came under pressure in late May after the U.S. indicated it might revoke Hong Kong's special trade status in response to China's move to implement new national security laws within the city. At one point, the iShares MSCI Hong Kong ETF (EWH) was down as much as 9.3% in response to this news.
Exhibit 1 features May market price performance figures for some ETFs representing most major asset classes. Investors in a blended global market portfolio gained just over 3% during the month. Stock markets were up across the board, though some fared better than others. Developed international stocks outperformed both U.S. and emerging-markets stocks.
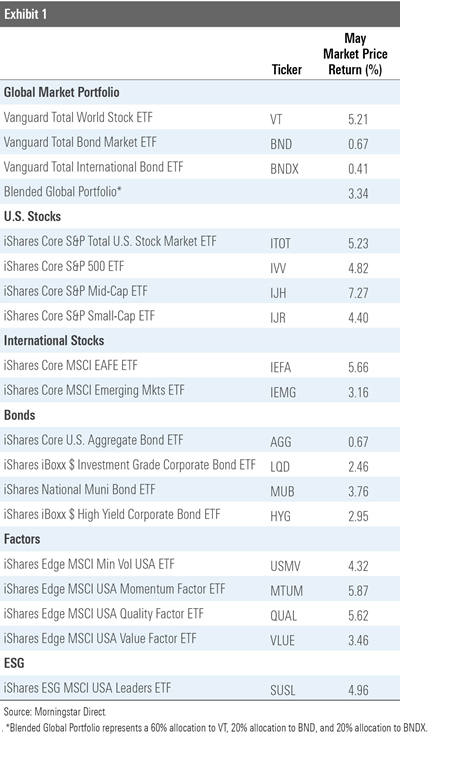
Within the U.S. market, mid-caps handily outperformed both large and small caps for the second month in a row. IShares Core S&P Mid-Cap ETF (IJH) outpaced iShares Core S&P 500 ETF (IVV), chiefly because of its exposure to better-performing names in the consumer discretionary and healthcare sectors. IJH also outstripped iShares Core S&P Small-Cap ETF (IJR) in May. In this case, much of its relative performance can be attributed to stock selection within the technology and healthcare sectors.
The performance spread across the diagonal of the Morningstar Style Box widened a bit in May. For example, iShares S&P 500 Growth ETF (IVW), which falls in the large-growth Morningstar Category, outperformed iShares S&P Small-Cap 600 Value ETF (IJS), which sits in small-value, by 3.4 percentage points. In April, IVW beat IJS by just 36 basis points. In March, IJS lagged IVW by nearly 15.5 percentage points. This year has put an exclamation point at what may or may not be the end of a decade-plus of suffering for value stocks.
Fixed-income markets continued to recover in May. Credit markets snapped back into order following the Federal Reserve's late-March intervention. Last month, the Fed began purchasing corporate-bond ETFs. As of May 29, the Fed had purchased shares of 15 different corporate-bond ETFs with a total market value of US$1.3 billion.
Strategic-beta ETFs representing a variety of individual factors had a mixed showing versus the broader U.S. stock market. Value-oriented funds continue to struggle on a relative basis. Meanwhile, momentum and quality stocks have been resilient.
ETF Flows Do the Safety Dance
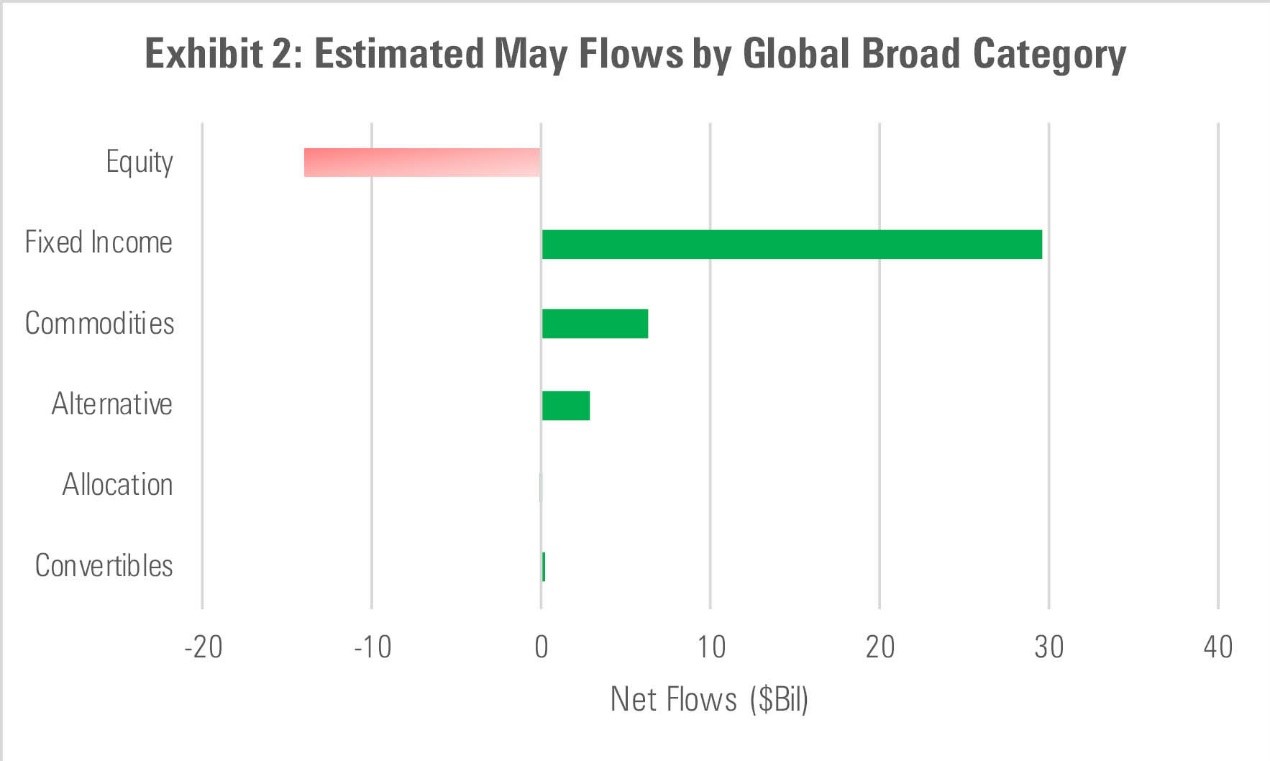
ETF flows again favored bond funds in May. Fixed-income ETFs took in nearly US$30 billion in net new flows--a monthly record. Over the past two months, estimated net flows into fixed-income ETFs amounted to just over US$51 billion. This is the largest two-month net flow into bond ETFs on record by a wide margin. The next-closest two-month stretch was June/July 2019, when investors added just over US$36 billion to bond ETFs.
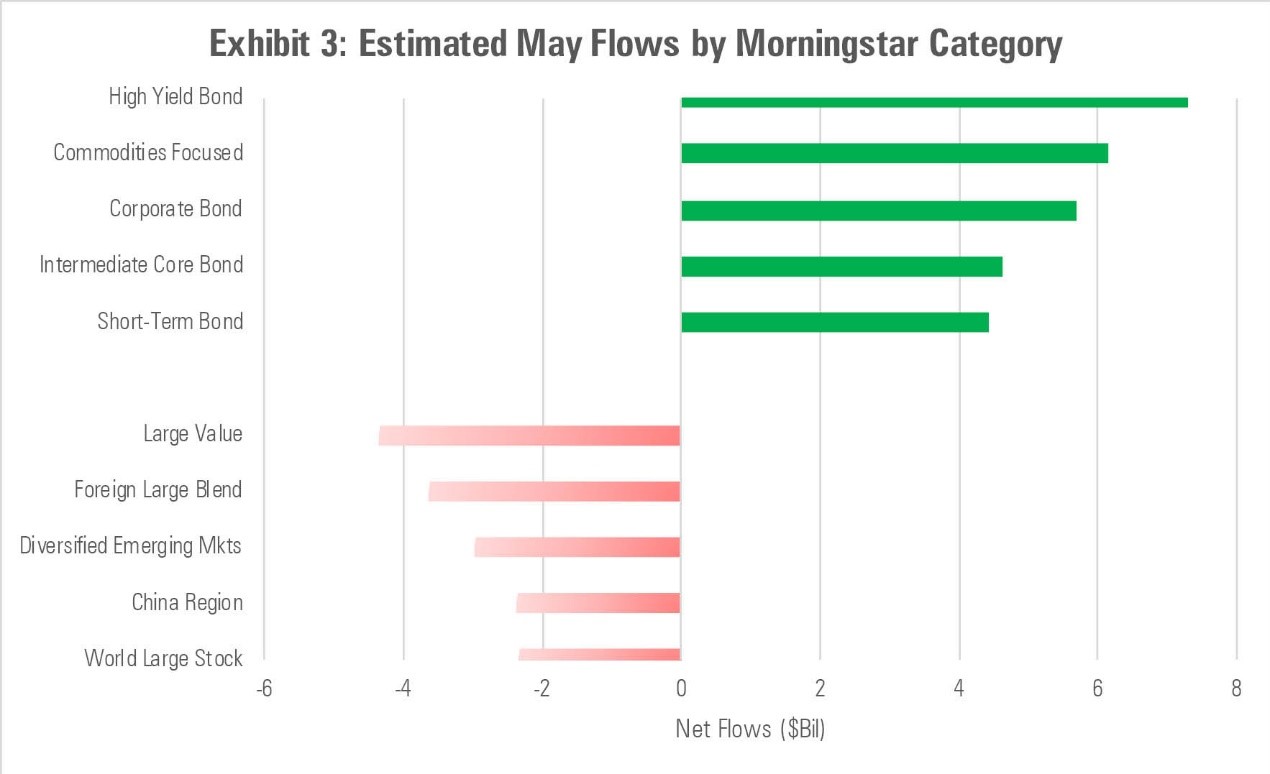
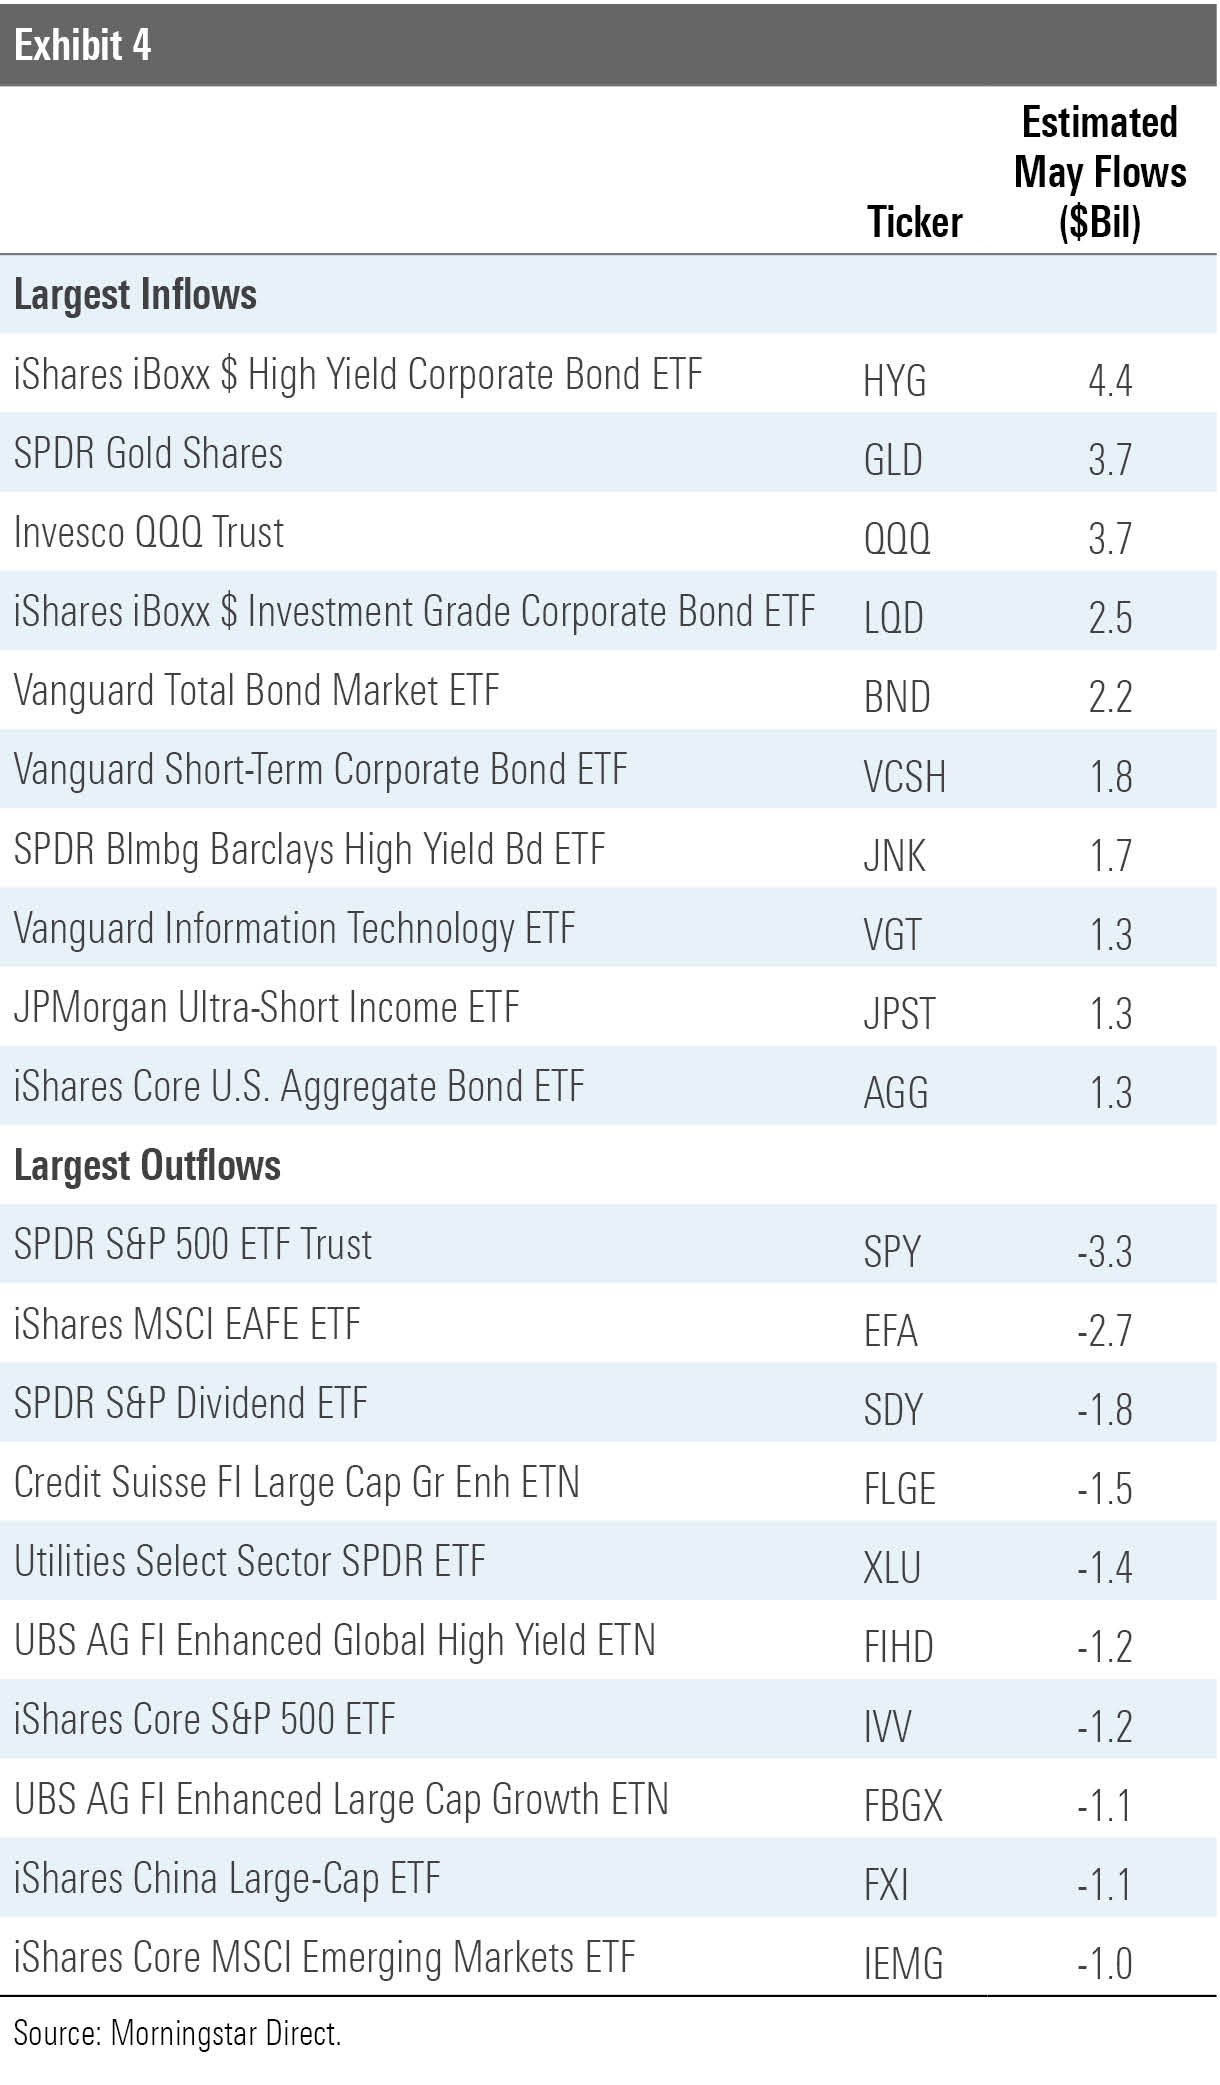
Notable among the asset-gatherers in the bond space were iShares iBoxx $ Investment Grade Corporate Bond ETF (LQD) and iShares iBoxx $ High Yield Corporate Bond ETF (HYG). Both funds featured prominently on the Fed's shopping list, ranking first and fourth by market value, respectively, on the roster of its May ETF acquisitions.
Physical gold ETFs continued to gain assets from safe-haven seekers. SPDR Gold Shares ETF (GLD) saw US$3.7 billion in net new inflows in May. This marks the sixth-straight month that GLD has seen net new inflows. In sum, investors have poured nearly US$13 billion in new money into GLD over the past six months. This is the highest level of absolute net new flows it has witnessed over any six-month span since its November 2004 inception.
Source: Morningstar Direct
Source: Morningstar Direct
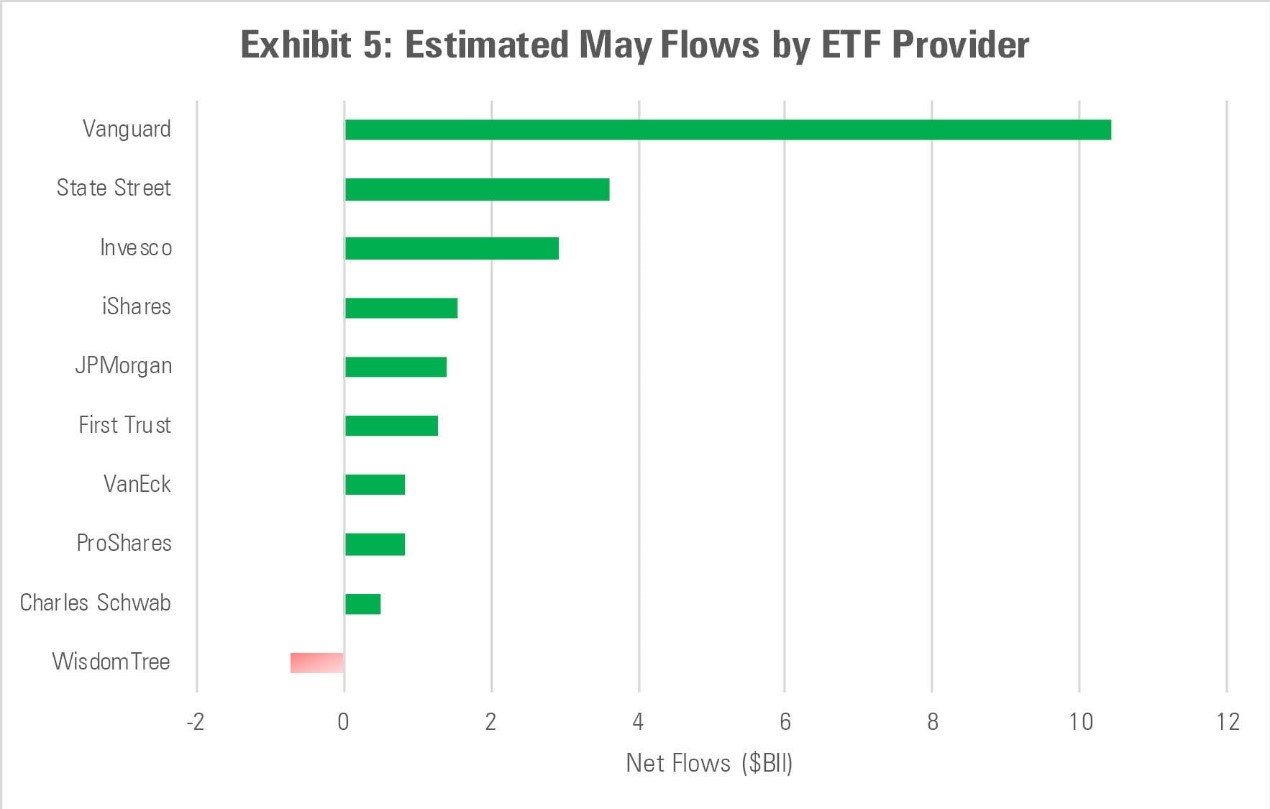
Looking at flows at an ETF issuer level can help tune out some of the noisiness that is a regular feature of short-term ETF flows and yield some signals. From this perspective (see Exhibit 5), it appears that the steady-Eddie clientele served by firms like Vanguard, which tend to serve more advisors and individual investors, remain steady as ever. Meanwhile, market volatility continued to be a boon for firms like State Street and ProShares, whose ranges cater to a crowd that tends to use ETFs in a more tactical manner.
Source: Morningstar Direct

.png)


