


The coronavirus pandemic will reverse globalization.
For some it’s a prediction, for others an aspiration. The virus’ rapid spread across the globe highlighted the fragilities of an interconnected world. Turning inward, increasing self-sufficiency, decreasing dependence on global linkages are plausible responses.
While global travel certainly ground to a halt in 2020, business does not appear to have become less global. That’s the conclusion reached when examining the revenue mix of publicly traded companies, aggregated to the index level.
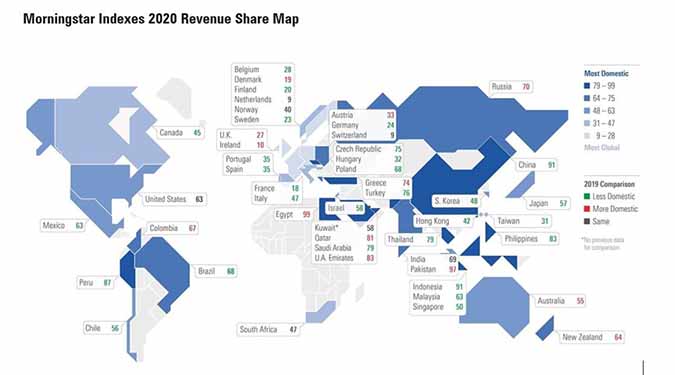
The world map below displays the share of revenue earned domestically for 49 markets across the globe, represented by Morningstar country indexes.[1] Estimates based on annual report data from 2020 shows only 13 countries becoming more domestically focused in 2020. Meanwhile, 29 markets became more globalized, with the share of revenues sourced outside the country increasing between 2019 and 2020. Nearly all Asian markets turned outward in 2020, despite their pandemic lockdowns. The Morningstar U.S. Market Index earned 63% of its revenue domestically in both 2019 and 2020, making it one of several countries whose mix did not change during the pandemic year.
Revenue Mix of Asian Companies
Across Asia, most markets became more global, despite borders closing and many economies struggling. Japan, China, Korea, Hong Kong, Taiwan, Singapore, Indonesia, Malaysia, Thailand, and the Philippines all saw an increase in the shares of revenues sourced globally in 2020. India did not change. Only Pakistan and a couple of Persian Gulf markets became more domestic.
To understand the aggregate numbers, consider the two of Asia’s leading companies: Tencent (00700) and CapitaLand (C31).
Tencent, like Alibaba (09988) and other Chinese tech giants, is largely a domestic player. Indeed, more than 90% of the revenues for the Morningstar China Index are sourced domestic, despite its export-led economic growth model. But Tencent saw a significant increase in the share of revenues coming from outside China in 2020. Tencent has aggressively expanded its online-gaming business globally, through acquisitions like Riot Games and Supercell, and strategic stakes in companies like Epic Games, Activision Blizzard, and Korea’s Bluehole. Tencent does not attribute revenues to specific markets outside of China, but online gaming got a global boost from the pandemic.
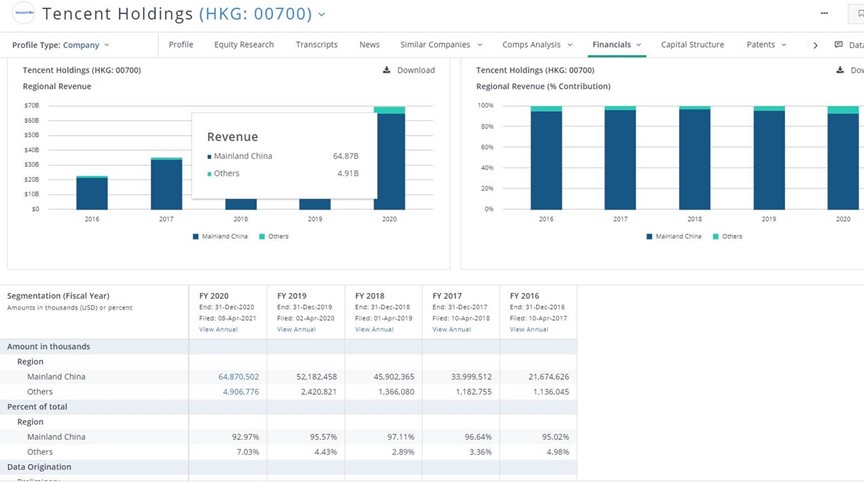
Source: PitchBook Platform. Morningstar Data.
In contrast to Tencent, CapitalLand of Singapore earns more real estate-related revenues from outside its home market. In 2020, CapitaLand saw a decline in the share of revenues sourced domestically and an increase in Chinese revenues. The Chinese economy was relatively robust in 2020.
On a global basis, technology companies like Tencent tend to be global. That is certainly the case for companies like Taiwan Semiconductor and Samsung Electronics. Healthcare, another global sector, contributes to the outward focus for markets like Denmark and Switzerland. Sectors like financial services, utilities, and telecom tend to be far more domestic. Sector weights help explain the inward orientation of many emerging markets, such as Indonesia, Egypt, and the United Arab Emirates.
More Global for Brazil
Brazil’s market became significantly more global in 2020, falling to 68% domestic from 77% in 2019 based on estimates from corporate filings. What’s going on? Iron ore miner Vale (VALE) and Petrobras (PBR), the oil and gas company, which together represent roughly 20% of the Morningstar Brazil Index’s market value, each saw a decline in their share of revenue sourced domestically.
This is undoubtedly due to Brazil’s struggles with COVID-19. As the pandemic has ravaged the country, causing the economy to contract by more than 4% in 2020 and unemployment to climb above 14%, Vale reported its share of revenue sourced from China increasing to 57.82% in 2020 from 48.55% in 2019. Robust economic activity in Chinese led to higher demand for the raw material to make steel.
BHP, the Australian mining giant, also saw an increase in revenue share from China, though the Australian equity market as a whole became more domestic in 2020, as did New Zealand's. This inward turn parallels measures both countries have taken to insulate themselves from the pandemic.
Russia also went more domestic in 2021, likely as an effect of sanctions undermining global revenues for some Russian businesses.
Between a Country's Economy and Equity Market
Globalized revenue streams provide yet another reason that investors should distinguish between a country’s economy and its equity market. One of the great investment lessons of 2020 is that the two can move in opposite directions. Although national equity-market indexes are often cited as barometers of their countries’ economic health, markets are a collection of very specific companies influenced by a variety of forces, macro and micro, domestic and global.
This is especially true of European equity markets. The Netherlands, Switzerland, Ireland, Denmark, France, Finland, Sweden, Germany, the United Kingdom, and Belgium all earn 70% or more of their revenues abroad. The Morningstar France Index, for example, is hardly a proxy for the French economy. Luxury-goods maker LVMH Moet Hennessy Louis Vuitton (LVMHF), the largest public company in France, derives more than one third of its revenues from Asia and roughly one fourth from the United States. Drugmaker Sanofi (SNYNF), the second-largest French company, reports the U.S. as its largest market.
The U.K. equity market already reflects the “Global Britain” envisioned post-Brexit. Just 27% of revenues are sourced domestically. Morningstar estimates that roughly 23% of the U.K. market’s revenue came from the U.S. in 2020, 17% from emerging Asia, and 12% from the eurozone.
The world’s most domestically oriented equity markets belong to emerging economies with large populations, topped by Egypt, Pakistan, Indonesia, and China. India is an exception to this rule, being far more global than China and others. This owes to IT service providers like Infosys (INFY) and Tata Consultancy Services (TCS), which both earn the lion’s share of revenue abroad, mostly in the U.S. and Europe.
Globalized revenue streams have been cited by some as reason to avoid investing internationally. If domestic companies are doing business around the globe, doesn’t that count as geographic diversification? Global interconnectedness has surely contributed to higher correlations between stock markets around the world.
But investors with significant home-country bias are narrowing their opportunity sets and eschewing great investment opportunities--companies that could even be leaders in their home markets. For example, a U.S.-based investor who doesn’t own Novo Nordisk (NVO) of Denmark is missing one of the leaders in diabetes therapies serving the U.S. equity market, while Taiwan Semiconductor (TSM) is a leading chip-supplier to the U.S. In fact, the U.S. share of Taiwan Semiconductor’s revenue increased to 61% in 2020 from 59%.
Corporate data from 2020 does not support the view that globalization is in decline. For investors, thinking globally remains critical.
[1] Index-level data is as of 30 April 2021, based on the most recent corporate filings, typically 2020 annual reports. Company-level revenue data represents 99.4% of global market capitalization across developed and emerging markets. Data has been collected for 7,311 of the 7,391 constituents of the Morningstar Global Markets Index, of which the individual country indexes are carve-outs.
Disclosure: Morningstar, Inc. licenses indexes to financial institutions as the tracking indexes for investable products, such as exchange-traded funds, sponsored by the financial institution. The license fee for such use is paid by the sponsoring financial institution based mainly on the total assets of the investable product. Please click here for a list of investable products that track or have tracked a Morningstar index. Morningstar, Inc. does not market, sell, or make any representations regarding the advisability of investing in any investable product that tracks a Morningstar index.


.png)


