


In a column from July 2018, I suggested that time travellers purchase $1,000 worth of Berkshire Hathaway (BRK.A) stock in 1975. That position would be worth $7.5 million today. Which got me thinking: How did BRK’s equity appear at that time?
Warren Buffett gained control of BRK in May 1965. The chart below depicts the value of a $10,000 investment in BRK over the next five calendar years, from 1966 through 1970. For comparison’s sake, I included the S&P 500 and the price change of a barrel of crude oil. (The latter two investments are theoretical: There were no tracker funds, and oil barrels came with storage costs.) All figures are adjusted for inflation.
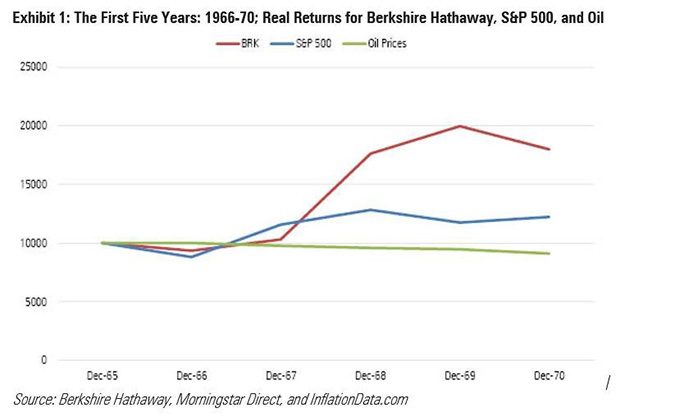
The S&P 500 was modestly ahead after two years, but then BRK gained 70% in 1968 and never looked back. It was more volatile than the index, to be sure, but volatile in the right direction. For their part, oil prices languished. Each year they gained slightly in nominal terms, but after inflation was considered, they dropped. This was five straight years of (admittedly modest) losses.
At that point, if forced to choose between the three options and given no more information than the past returns, most investors surely would have selected BRK. True, the company had only a five-year history under current management, and holding its stock was riskier than owning an index’s basket, but the returns were high enough to overcome the objection. Crude oil, of course, could easily be ruled out
Berkshire Hathaway in the 1970s
Fast-forward through the next five years and boy, did things change. BRK began where it had left off, by appreciating 73% in 1971. Then came the collapse. After a slight gain in 1972, BRK dropped modestly the next year, shed 54% (!) of its value in 1974, and ended the period by losing once again. In real terms, that whippersnapper Warren Buffett turned $10,000 of January 1971 money into less than $7,200. The Oracle of Omaha, indeed! More like the Numbskull of Nebraska.
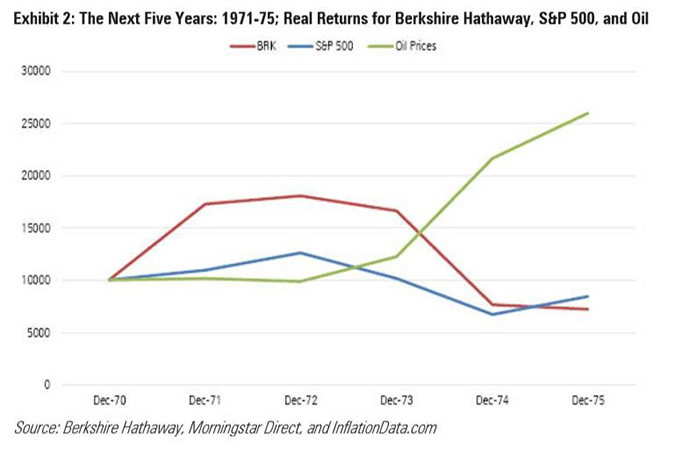
The S&P 500 wasn’t a whole lot better, but at least it finished above BRK and with less (although still significant) turbulence. Meanwhile, crude oil was terrific. After two more years of coasting, it surged from 1973 through 1975, to turn a $10,000 hypothetical investment into almost $26,000. It completed the period worth more than the other two choices combined.
This brief tale is a contrarian’s delight. The first period’s winner became the next period’s loser, while its loser turned into its winner. (The middle child, the S&P 500, remained as such.) In addition, the second chart directly addresses the initial question of how BRK’s stock appeared to 1975’s investors: dangerous. This company could lose money in a hurry – and did.
The Full Picture
Of course, 1975’s investors weren’t limited to five years’ worth of data. They would not only know what transpired over the previous half decade, as shown in the second chart, but also what occurred during the first chart. But examining the full 10-year totals, by combining the two charts, would surely lead to better insight.
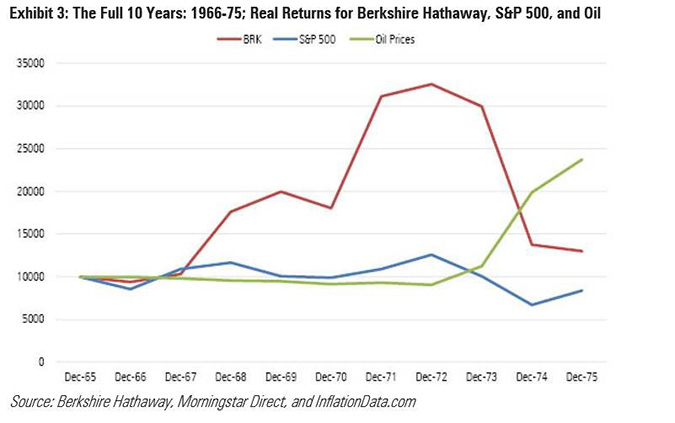
Not entirely. For the decade, BRK notched a modest real profit of just over 2% annually (30% cumulatively), while the S&P 500 lost money. Aggressive investors might have selected BRK rather than a market portfolio. On the other hand, BRK’s shares had bounced around heavily, enough to make the S&P 500 the superior choice for risk-aware buyers.
The bottom line is, after 10 years of Buffett’s management, BRK’s stock market performance suggested few hints of his genius. Yes, BRK had twice surged by more than 70% in a calendar year, but its best result among the eight remaining years was a 13% gain, and it had lost money on five of those occasions. Today, BRK is regarded as the closest thing to an investment machine, appreciating year after year, decade after decade. The stock was not like that back in the day.
Why Book Value is Important
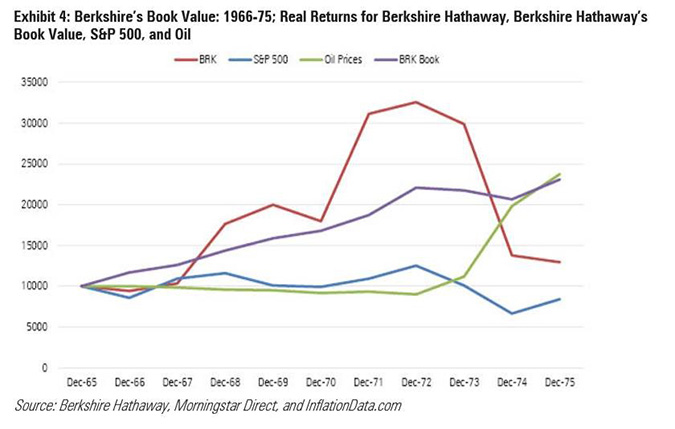
There was a clue for the observant, though: the company’s book value. Investors can’t purchase a company’s book value, of course; they must instead buy its publicly traded shares, in the expectation that, over the long haul, the company’s stock price will move in tandem with its book value. That has indeed occurred with BRK, which at its 50-year anniversary reported a 21.6% annual nominal gain in its stock price and 19.4% growth in its book value. (The S&P 500 was at 9.9%).
Over shorter periods, however, the stock may disengage itself from the book price. That was certainly the case for BRK. This column’s fourth and final chart repeats the previous effort, but with the addition of the real change in BRK’s book value. This time, we have a winner! The purple line of book value clearly beats the three alternatives. It has by far the steadiest performance and misses by a whisker of also posting the highest cumulative gain.
Lessons from this exercise:
1) By all means, don’t make decisions based on five-year returns. You knew that already, but it’s worth pointing out that many mutual fund trades continue to be driven by five-year results.
2) Ten-year totals are better but still imperfect. From 1966 through 1975, the most successful investment manager in the public markets looked ordinary. Granted, that was his single worst 10-year stretch; every other early decade would have yielded different conclusions. But then again, Buffett has been the very best. Lesser managers would suffer more down periods.
3) Book-value growth judged Buffett’s quality better than did share-price performance. Unfortunately, we can’t extend that insight, because Berkshire Hathaway isn’t structured as other investment funds are. It calculates a book value, while they do not. (Net asset value has certain properties that are similar, but it is not a match.) Ah, well. Not every finding can be generalised.
©2021 Morningstar. All rights reserved. The information, data, analyses and opinions presented herein do not constitute investment advice; are provided as of the date written, solely for informational purposes; and subject to change at any time without notice. This content is not an offer to buy or sell any particular security and is not warranted to be correct, complete or accurate. Past performance is not a guarantee of future results. The Morningstar name and logo are registered marks of Morningstar, Inc. This article includes proprietary materials of Morningstar; reproduction, transcription or other use, by any means, in whole or in part, without prior, written consent of Morningstar is prohibited. This article is intended for general circulation, and does not take into account the specific investment objectives, financial situation or particular needs of any particular person. Investors should consult a financial adviser regarding the suitability of any investment product, taking into account their specific investment objectives, financial situation or particular needs, before making any investment decisions. Morningstar Investment Management Asia Limited is licensed and regulated by the Hong Kong Securities and Futures Commission to provide investment research and investment advisory services to professional investors only. Morningstar Investment Adviser Singapore Pte. Limited is licensed by the Monetary Authority of Singapore to provide financial advisory services in Singapore. Either Morningstar Investment Management Asia Limited or Morningstar Investment Adviser Singapore Pte. Limited will be the entity responsible for the creation and distribution of the research services described in this article.


.png)


