


In sharp contrast to its painful losses in recent years, ARK Innovation ETF’s ARKK performance has perked up over the past few months. The fund suffered a 23.5% loss in 2021, followed by an even more severe 66.9% drop in 2022. As the overall market has improved and growth stocks have returned to the fore, ARKK has gained 29.6% for the year to date through May 31, 2023.
Over longer periods, though, the fund’s performance remains decidedly mixed. ARK founder and portfolio manager Cathie Wood makes concentrated bets on companies with high earnings growth potential in areas such as artificial intelligence, blockchain, DNA sequencing, energy storage, and robotics. Because its strategy courts extreme levels of risk on multiple dimensions—including concentration, momentum, liquidity, valuation, and financial health—performance often tends toward extreme highs and lows. Although ARKK’s returns over the full period since inception (spanning November 2014 through May 2023) are slightly better than the mid-cap growth category average, its returns for the trailing five-year period land in the bottom 2% of its peer group.
But because of the timing of cash flows into the fund, the returns shareholders have actually experienced have been significantly worse. In this article, I’ll update my analysis of the gap between the fund’s reported total returns and the results shareholders have actually experienced, as well as explain why poorly timed asset flows are the major culprit.
Fund Flow Issues
I last wrote about this issue in December 2021. To estimate how ARKK’s shareholders have fared, I looked at monthly asset flows since inception, as well as asset totals at the beginning and end of each period. I then used these monthly cash flows to calculate an internal rate of return, which measures performance for the average dollar invested in the fund. It is important to note that various complicating factors make it difficult to pin down exact investor-return numbers for exchange-traded funds [1], but the numbers below should be directionally accurate.
Investor Returns vs. Total Returns for ARK Innovation
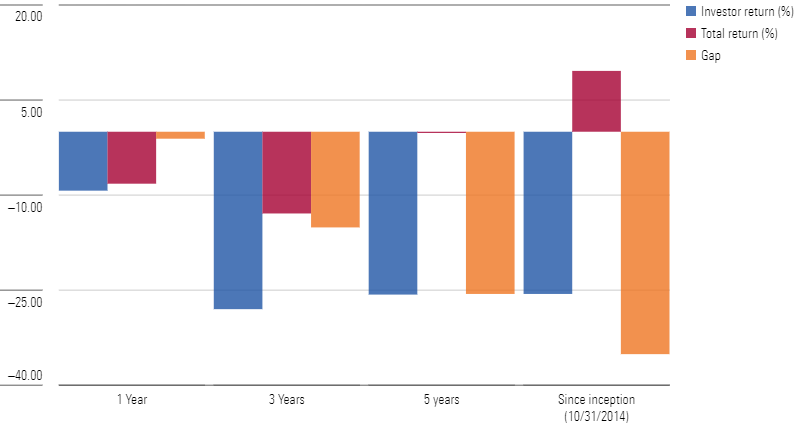
The performance gaps haven’t significantly improved when using updated data through May 31, 2023. As the chart above illustrates, investors’ actual results lagged reported total returns over all four trailing periods. Over the past 12 months, dollar-weighted returns have lagged total returns by about 1 percentage point, which isn’t terrible. Over longer periods, though, the picture looks considerably worse. After adjusting for the timing of cash inflows and outflows, we estimate that shareholders suffered a 28% dollar-weighted average loss for the trailing three-year period, which is more than twice the fund’s reported loss over that span. Dollar-weighted returns lagged by even more over the trailing five-year period, trailing reported total returns by more than 25 percentage points.
But it is the dollar-weighted returns since the fund’s late 2014 inception that paint the most alarming picture. As mentioned above, ARKK’s 9.59% annualized return over its full life span has outpaced that of the average mid-cap growth fund by about 1.6 percentage points per year. But after adjusting for the timing of cash inflows and outflows, we estimate that investor returns were far worse—instead of enjoying positive returns, dollar-weighted returns were sharply negative. What’s more, ARKK has experienced breakneck volatility and drawdown risk, making any risk-adjusted measure of its dollar-weighted returns even more worrisome.
What Went Wrong
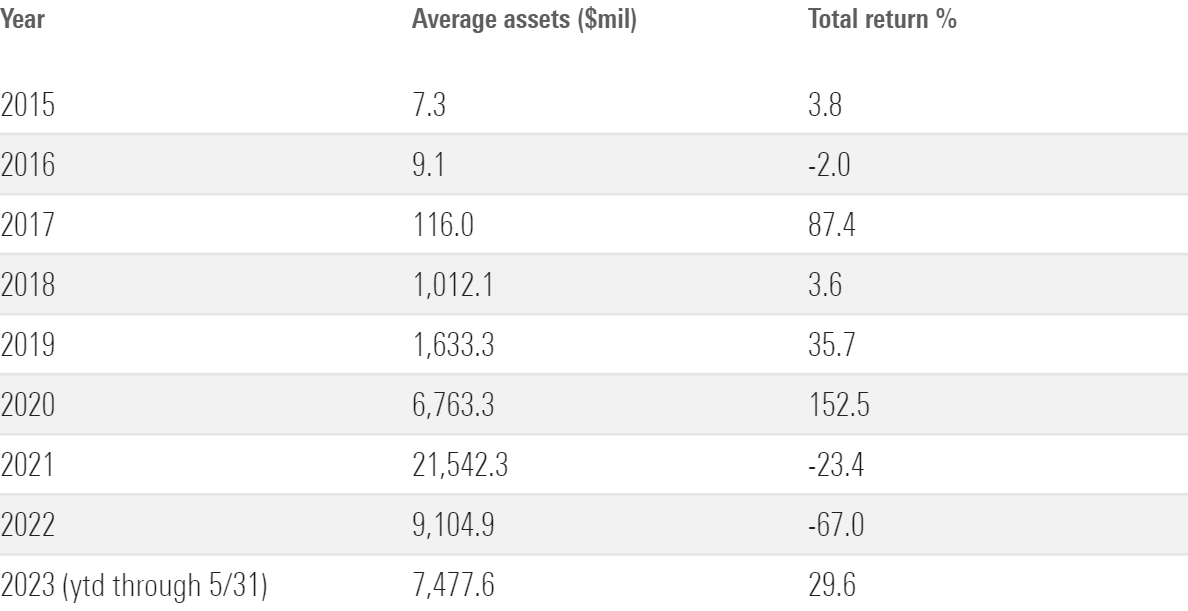
The difference between ARKK’s time- and dollar-weighted returns comes down to a simple reason: Most of its returns came when fewer shareholders were around to benefit from them. Even during 2017, when it posted an impressive gain of 87.4% (partly driven by a 1,300% runup in then-top-holding Grayscale Bitcoin Trust), it averaged only about $116 million in assets. By the time assets peaked around $25.5 billion in June 2021, performance was just about to drop off. Previously high-flying holdings such as Teladoc Health TDOC, Roku ROKU, and Zoom Video Communications ZM crashed back to earth in the second half of the year, and the fund shed about 23.9% of its value for the full year in 2021.
Average Assets and Total Returns by Year
The saga continued in 2022. The fund started the year with assets of about $16.2 billion, and those assets were fully exposed to the fund’s sharp losses in 2022. As market worries about stubbornly high inflation, rising interest rates, geopolitical risk, and a potential recession touched off a bear market, the type of stocks the fund favors—namely a concentrated portfolio full of high-growth bets trading at steep valuations and focusing on emerging technologies—fared the worst.
By the end of 2022, assets had dropped to $6.0 billion—less than one fourth of the peak levels from 2021. As a result, fewer dollars were around to benefit from the fund’s partial recovery in the first few months of 2023.
On the Bright Side
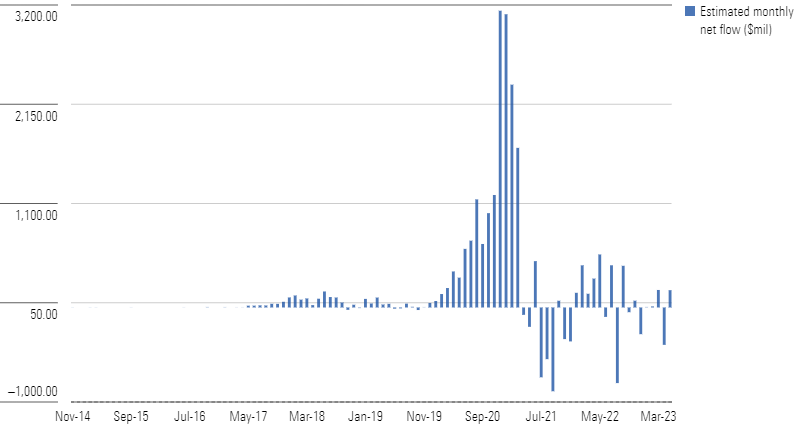
While the huge gap between investor returns and total returns is unusually wide, it could have been even worse. As shown in the table below, most of the fund’s monthly net inflows have been positive. This is in contrast to a common story line in the investment world, where shareholders often bail out after a period of poor performance. Despite a few months of net outflows, the fund actually saw net inflows (totaling about US$1.3 billion) for the full year in 2022. Outflows have totaled about $12 million for the first five months of 2023, but that’s a relatively small percentage of the fund’s total asset base.
The real culprit, in ARKK’s case, was the flood of assets into the fund in late 2021, after it had already posted its best returns.
Estimated Monthly Net Flows
Conclusion
Even so, ARKK’s massive investor-return gaps illustrate the perils of investing in hyperaggressive growth funds with eye-catching total returns. By the time performance captures the popular imagination (leading to an influx of new assets), market conditions have often changed. That’s particularly true for the type of high-growth story stocks favoured by funds similar to ARKK. Overall, the gap between shareholders’ actual returns and reported total returns underscores the perils of getting caught up in the hype of funds with high-flying returns, which usually leads to disappointing results.
[1] There are various factors that make it difficult to calculate precise investor-return numbers for ETFs. For one, investors who establish short sales positions engage in create-to-lend transactions, and demand from these short sales registers as net inflows (at least initially) in the same way as demand from long buyers. Depending on the timing of purchases and sales, some of these short-sellers may actually experience positive investor returns.
Long demand from market makers who purchase ETF shares and/or associated options for the purpose of building inventory and/or hedging existing exposures can also have an impact on estimated net inflows and total assets.
Finally, many ETF trades are made on the secondary market. Because these secondary-market trades typically don’t prompt new share issuance, they’re not reflected in estimated net inflow figures.

.png)


