


The classic balanced portfolio of 60% stocks and 40% bonds has rebounded from its worst year in more than a decade but remains besieged by naysayers and doubters. While there are lessons to be learned from the portfolio’s sharp stumble in 2022, valuations point to better times ahead for the old-school portfolio.
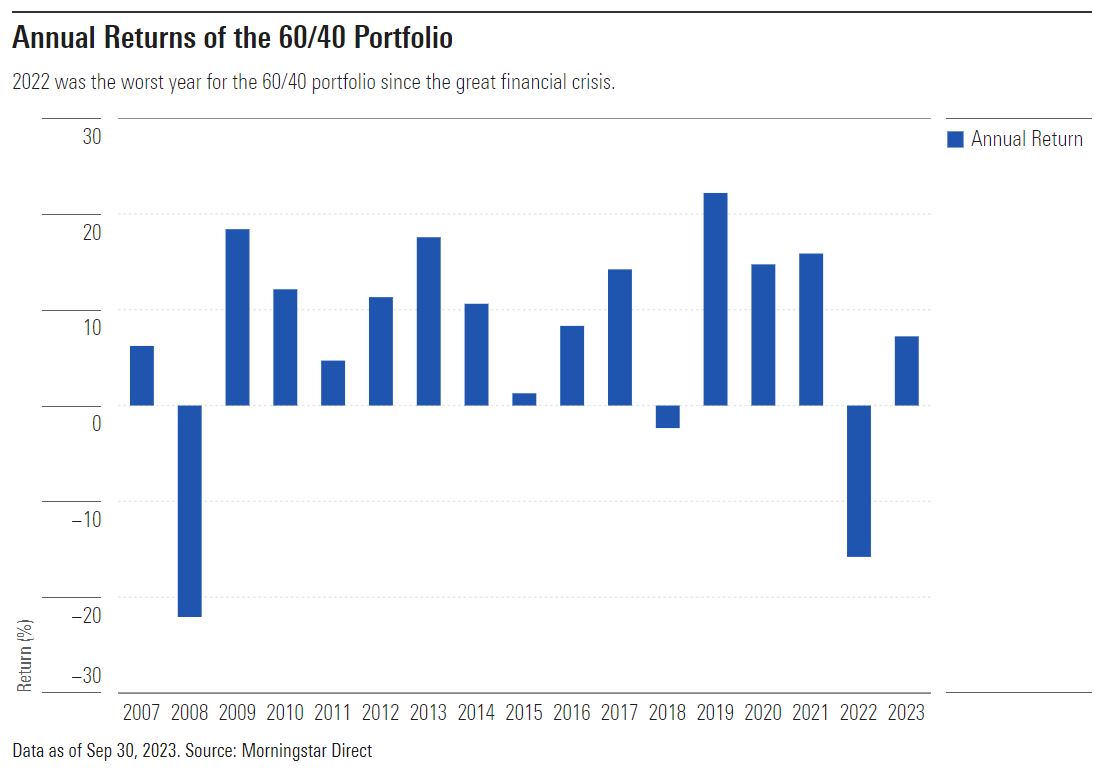
In 2022, the 60/40 portfolio [1] suffered its worst year since the 2008 global financial crisis. The malefactor was rampant inflation. First, it forced the central banks to aggressively hike interest rates, laying waste to intermediate-term bond portfolios. Higher interest rates forced a repricing of the stock market, especially for companies with high valuations relative to peers. With both stocks and bonds suffering losses, the portfolio lost its characteristic “balance” and fell more than 20% from peak to trough in 2022, before rebounding in the latter half of the year to finish with a loss of just under 16%. This year, it has delivered about a 7% return through the end of September, but that hasn’t quieted its detractors.
A Look at the 60/40 Portfolio′s Valuation Shows a Return to More Normal Valuation
The 60/40 portfolio’s valuation looks better after 2022′s drawdown and interest rates continued climb in 2023; they’re more in line with historical norms after hitting a nearly 30-year peak in late 2021.
To measure the valuation of the portfolio, we used two forward-looking metrics dating back to mid-1995, the earliest the data was available. For the stock portfolio, we looked at the forward price/earnings ratio; for the bond portfolio, we looked at yield-to-worst.
Forward P/E ratios are the consensus best guess for what company earnings will be in the future. It’s a good way to capture the growth expectations that are priced into the market. Like any good crystal ball, however, it only offers hints at the future, never fully revealing what’s to come. Nonetheless, lower forward P/E ratios are generally better starting points than higher forward P/E ratios.
Bond investors are stereotyped as being more pessimistic than stock investors and always focusing on what could go wrong. Yield-to-worst captures that paranoia better than other data points. It calculates the lowest yield an investor can expect if factors that befuddle basic bond math like call provisions and prepayments come into play. The higher the yield-to-worst is, the more attractive that basket of bonds is, and vice versa.
Since the two metrics move in opposite directions, we asset-weight each ratio (60% forward P/E and 40% yield-to-worst) and subtract the yield-to-worst from the forward P/E ratio. For example, at the end of September, the forward P/E of the S&P 500 was about 19 and the yield-to-worst for the Aggregate Index was 5.37. So we calculate ((0.6*19)-(.4*5.37)) and get 9.28. That number on its own is useless, but it allows us to compare how the valuations of the 60/40 portfolio have changed over time and how it compares now. The chart below shows how many standard deviations the valuation of the portfolio has been above or below its mean.
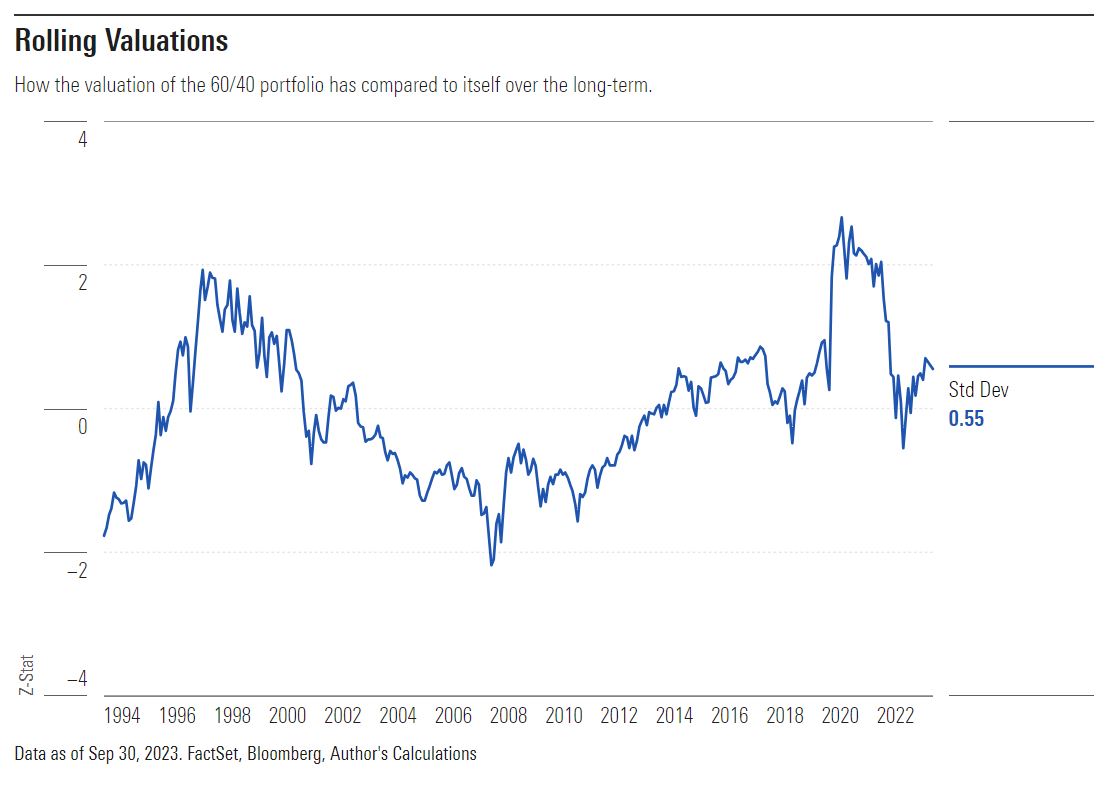
This calculation, typically called a z-score, shows the 60/40 portfolio looked more expensive at the end of 2021 than it at any point in nearly 30 years, surpassing the previous high of the early 2000s dot-com bubble. It has since collapsed as rates have risen, making the bond portfolio more attractive, and stocks continue to trade under recent valuation peaks.
The cheapest the portfolio got in our study was October 2008, four months before the bottom of the global financial crisis. That’s when analysts predicting corporate earnings were their most pessimistic.
Lower Valuations Have Typically Led to Better Future Returns
It’s a fool’s errand to try market-timing a core holding like the 60/40 portfolio (and most investments), but keeping valuations in mind can help set expectations and keep investors from hurting their results by buying and selling at the wrong times.
Morningstar’s role in a portfolio framework recommends a holding period of six to 10 years for a balanced fund, so we looked at the average seven-year returns (a common time frame for a full market cycle) based on the starting valuations. We also looked at the average three-year returns because we know it is too tempting to not think shorter-term sometimes. The average seven-year return was 6.79% annualized over the time period and the average three-year return was 7.55% over the period. Exhibit 3 shows that returns varied depending on whether the portfolio started at a higher- or lower-than-average valuation point.
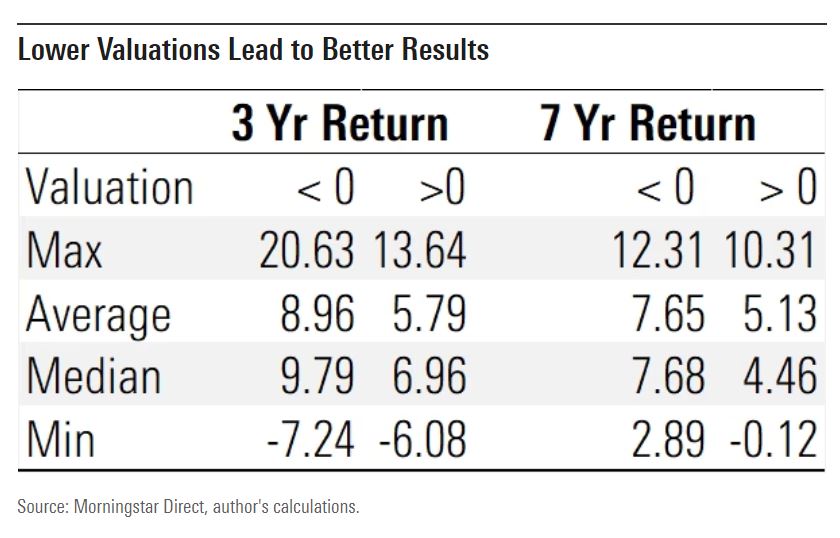
In general, the portfolio performed better when starting at a cheaper valuation, but that hasn’t always been the case. Its worst three-year performance, for example, was a 7.24% loss from March 2006 through February 2009 when the portfolio was almost 1 full standard deviation cheaper than the mean. That period captured the equity market’s peak before the financial crisis in October 2007 and the entire fall up to March 2009.
Given the portfolio is still above the long-term median valuation, investors may want to temper their expectations and plan for something less than the long-term average returns. But that doesn’t mean they should shun the portfolio. Like any good valuation metric, this one works best at the extremes. Exhibit 4 shows the range of returns when the valuation is more or less than 1 standard deviation from the mean.
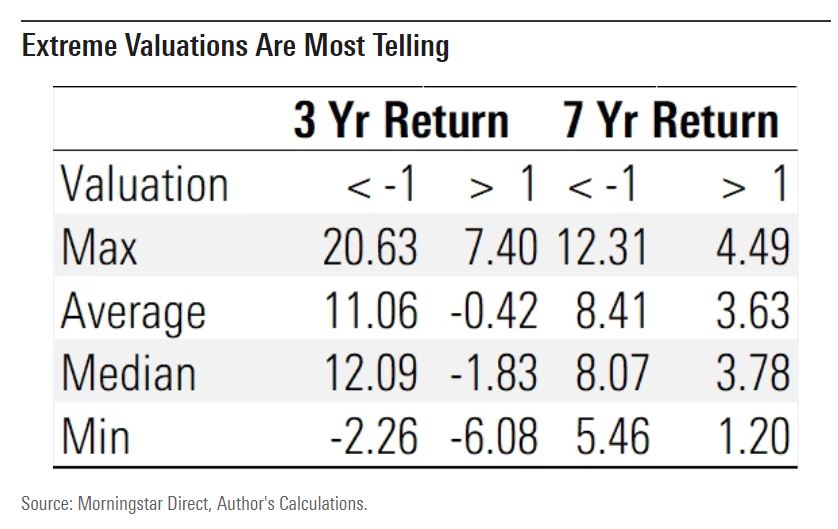
It shows that the worst outcomes happened when the portfolio was trading at more than 1 standard deviation above its mean; it traded above 2 standard deviations from the mean for most of 2021 right before the 2022 drawdown it has yet to recover from.
Longer Holding Periods Improve the Chances of Success
There is one thing investors can do to improve their odds of success with a 60/40 portfolio: Hold it longer.
We used the historical returns dating back to October 1995 in a Monte Carlo simulation to calculate the odds of the portfolio losing money over different periods.
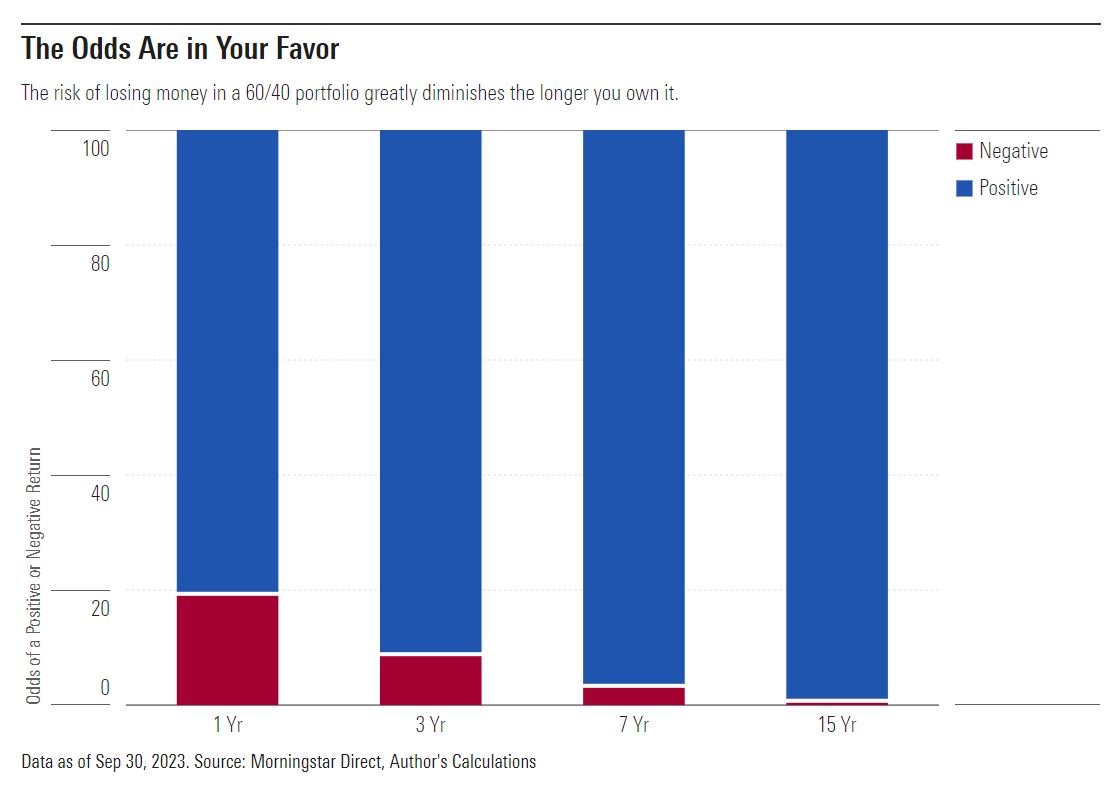
Over one year, there’s about a one in five chance of losing money, but over 15 years the odds drop to less than 1%. There’s no guarantee that a 1% chance of loss won’t happen or won’t be painful, but it confirms Morningstar’s recommendation to hold the portfolio for longer periods.
What’s the Outlook?
Rising interest rates continue to pose a near-term risk for the 60/40 portfolio, but it is designed to deliver over longer periods. Based on the most recent valuation, the portfolio looks slightly more expensive than the norm, but not overpriced. So investors should check expectations but don’t have to check out.
[1] For the purposes of this article, we are using 60% S&P 500 and 40% Aggregate Index, rebalanced monthly, for the basic 60/40 portfolio.
:quality(80)/cloudfront-us-east-1.images.arcpublishing.com/morningstar/DSZYYKGIYFHBRCV5ODLKEA4PWU.jpg)


.png)


