


Well, that was a surprise.
From the economy avoiding a recession to the massive stock market rally, 2023 defied expectations.
Heading into the year, investors expected more difficulty for the stock and bond markets after the 2022 bloodletting. The stock market's outlook certainly seemed dicey; the Federal Reserve was continuing its unprecedented series of interest rate increases, and most investors felt "the most-advertised recession in history" was just months away. Even those in the more optimistic camp felt we would see mid-single-digit gains at best by year-end.
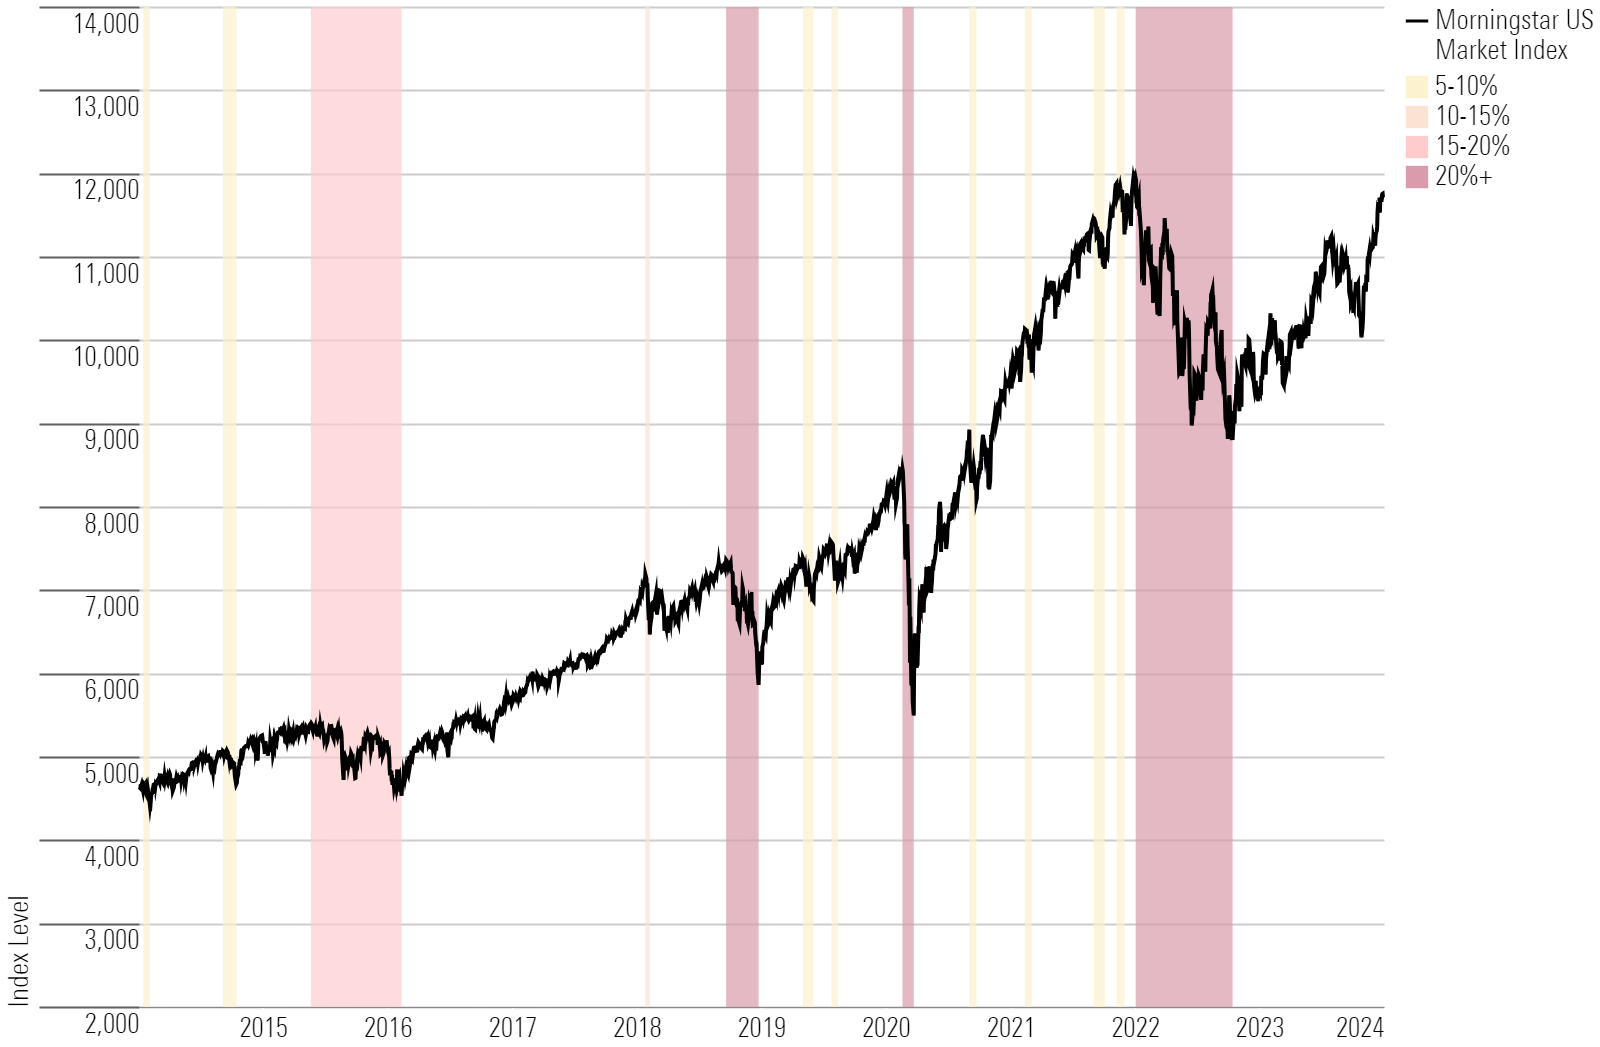
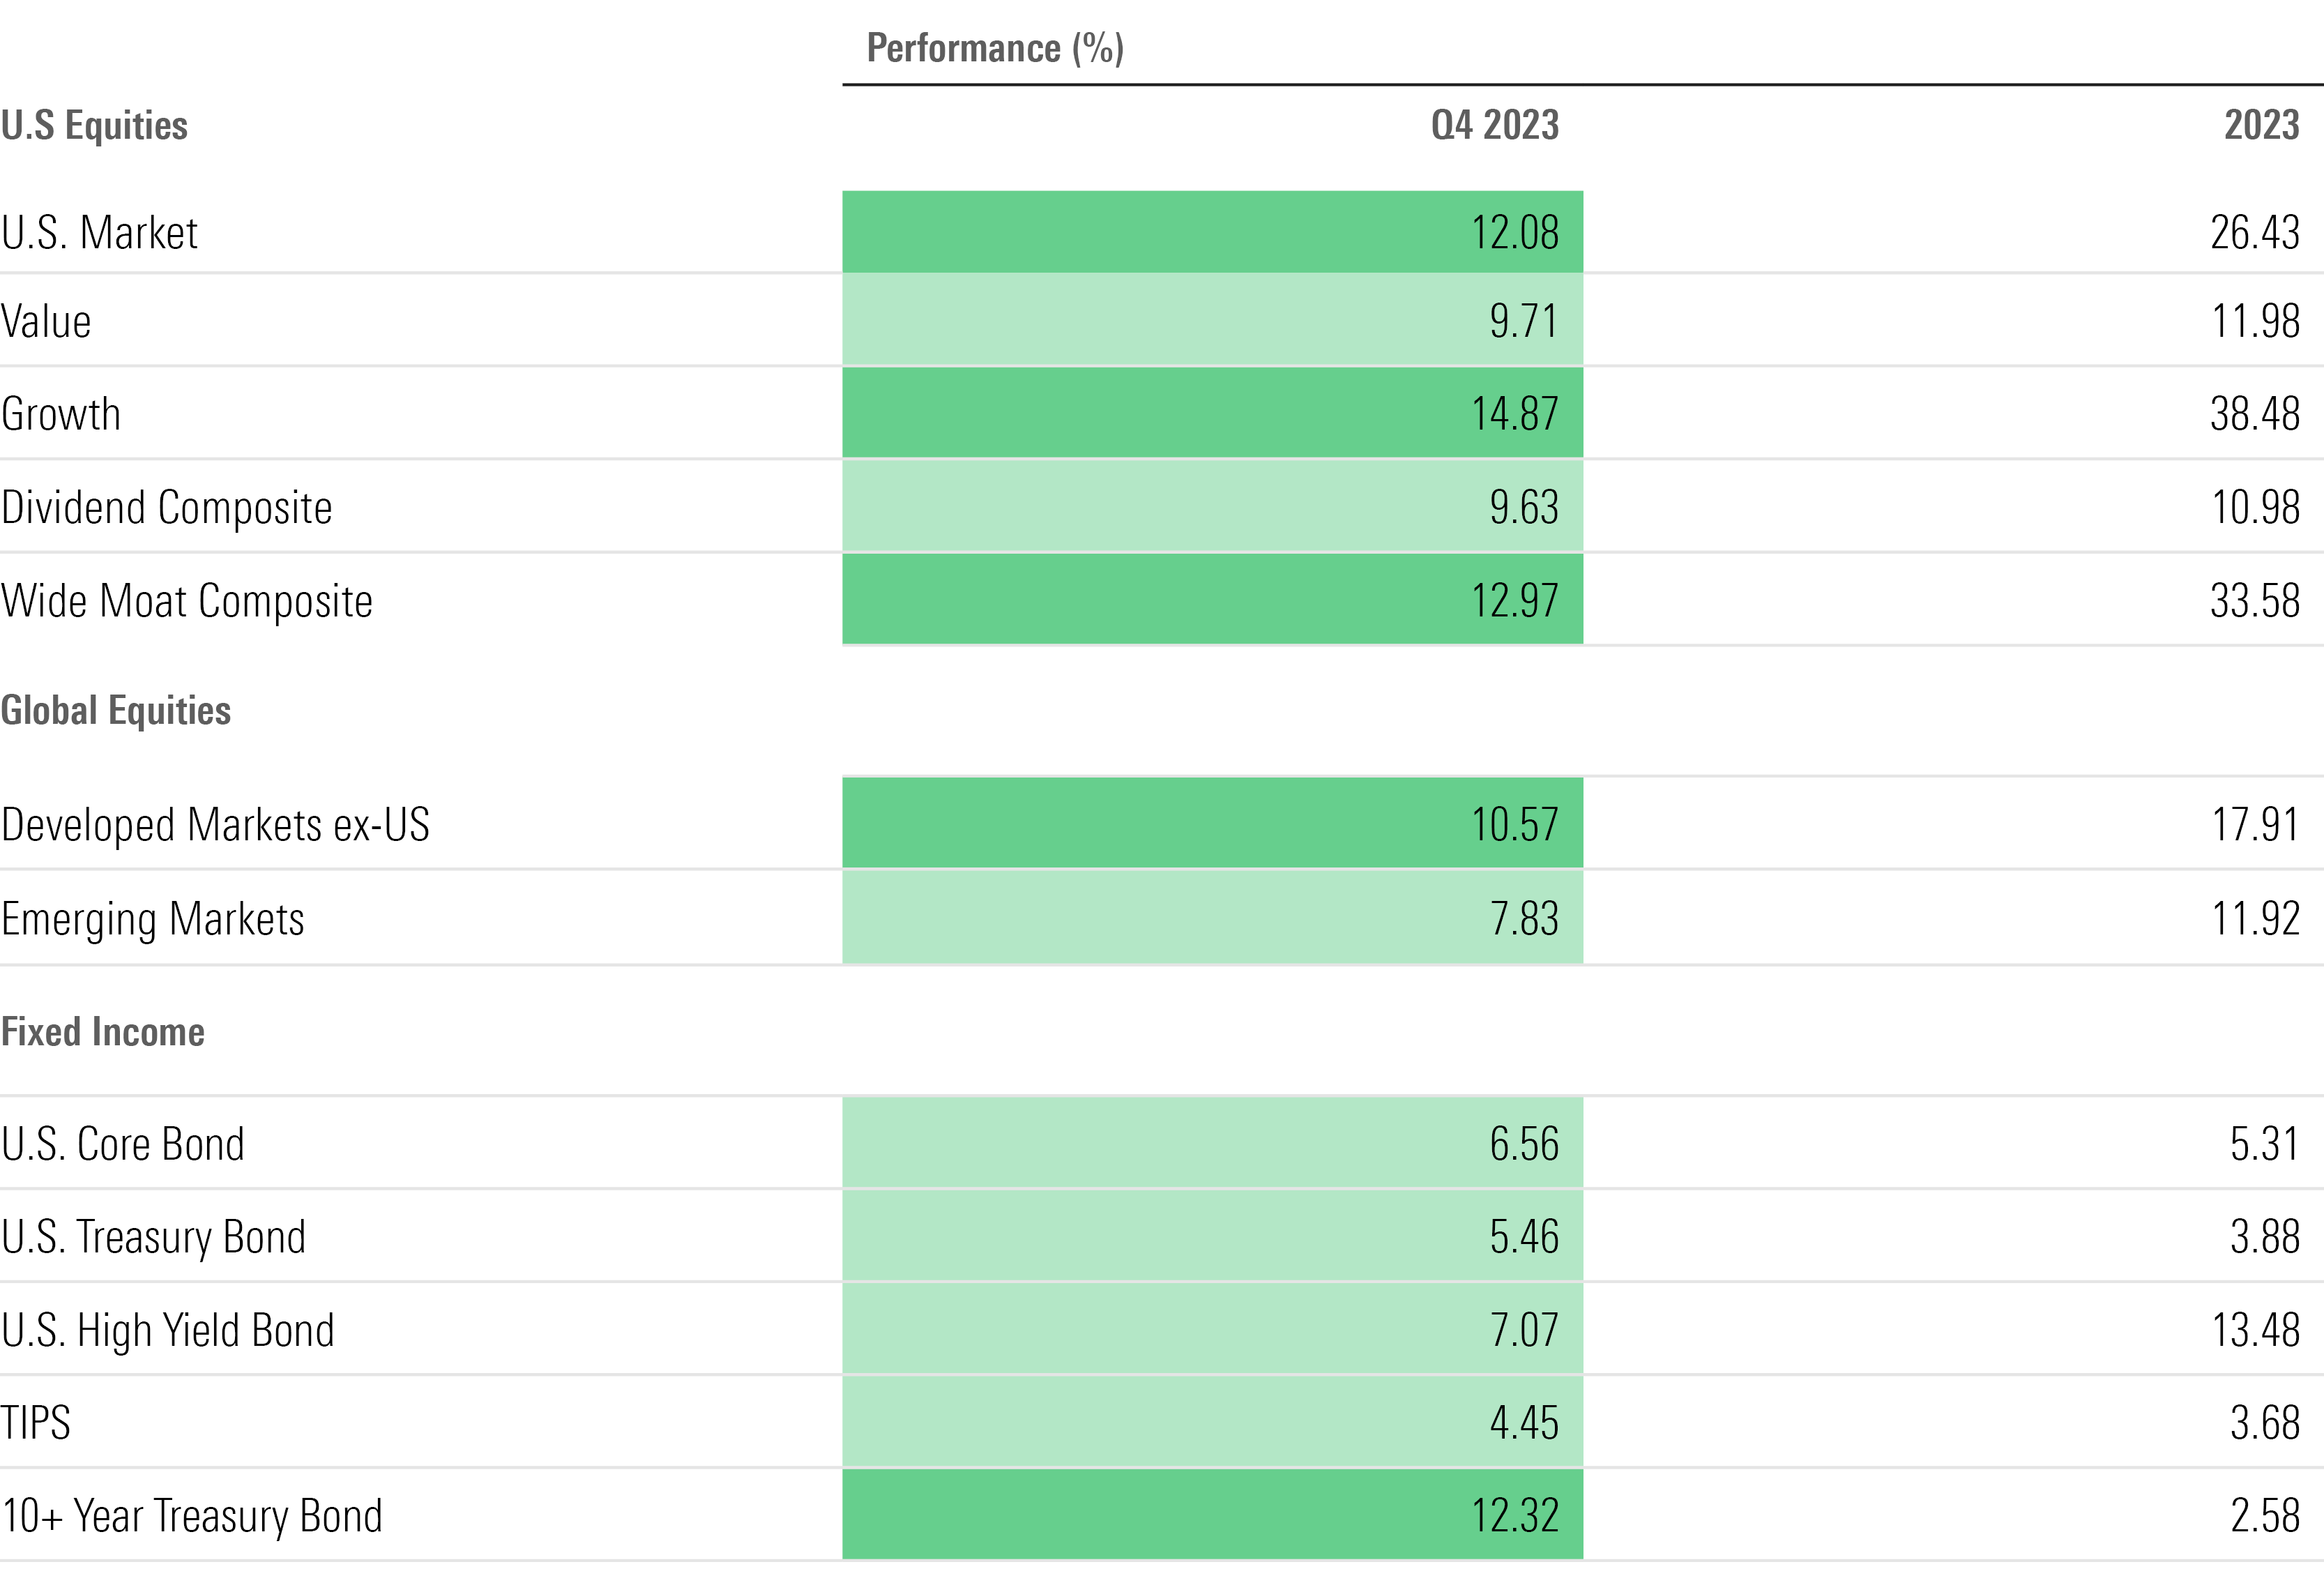
Instead, 2023 turned into one of the biggest years for stock market performance in the past decade, with the Morningstar US Market Index up 26.4%. It was especially good for the kinds of mega-cap technology stocks and other growth companies that suffered the biggest losses in the 2022 bear market.
The poster child for the 2023 rally is semiconductor chip designer Nvidia (NVDA), whose stock rallied a massive 239% during the year, as the emergence of artificial intelligence (AI) technologies looked to reshape the tech-stock landscape. In 2022, Nvidia's value had been cut in half.
Bonds also managed a noteworthy comeback, even if the gains were small for most investors.
The catalyst behind the reversal of fortune was the shift in Fed policy from interest rate increases to cuts for 2024. While markets wrongly priced in such a pivot several times over the past year and a half, by year-end, inflation pressures had turned strongly enough toward disinflation to make it a reality.
Here are some of the highlights of 2023's markets.
Key Stats: 2023 Stock and Bond Market Performance
- US Stocks rose 26.4% (including dividends), the biggest rally in the US Market Index since 2019;
- Stocks were up 12.1% in the fourth quarter, the index's best quarterly performance since late 2020;
- Since hitting their bear-market low in October 2022, stocks have rallied 36%;
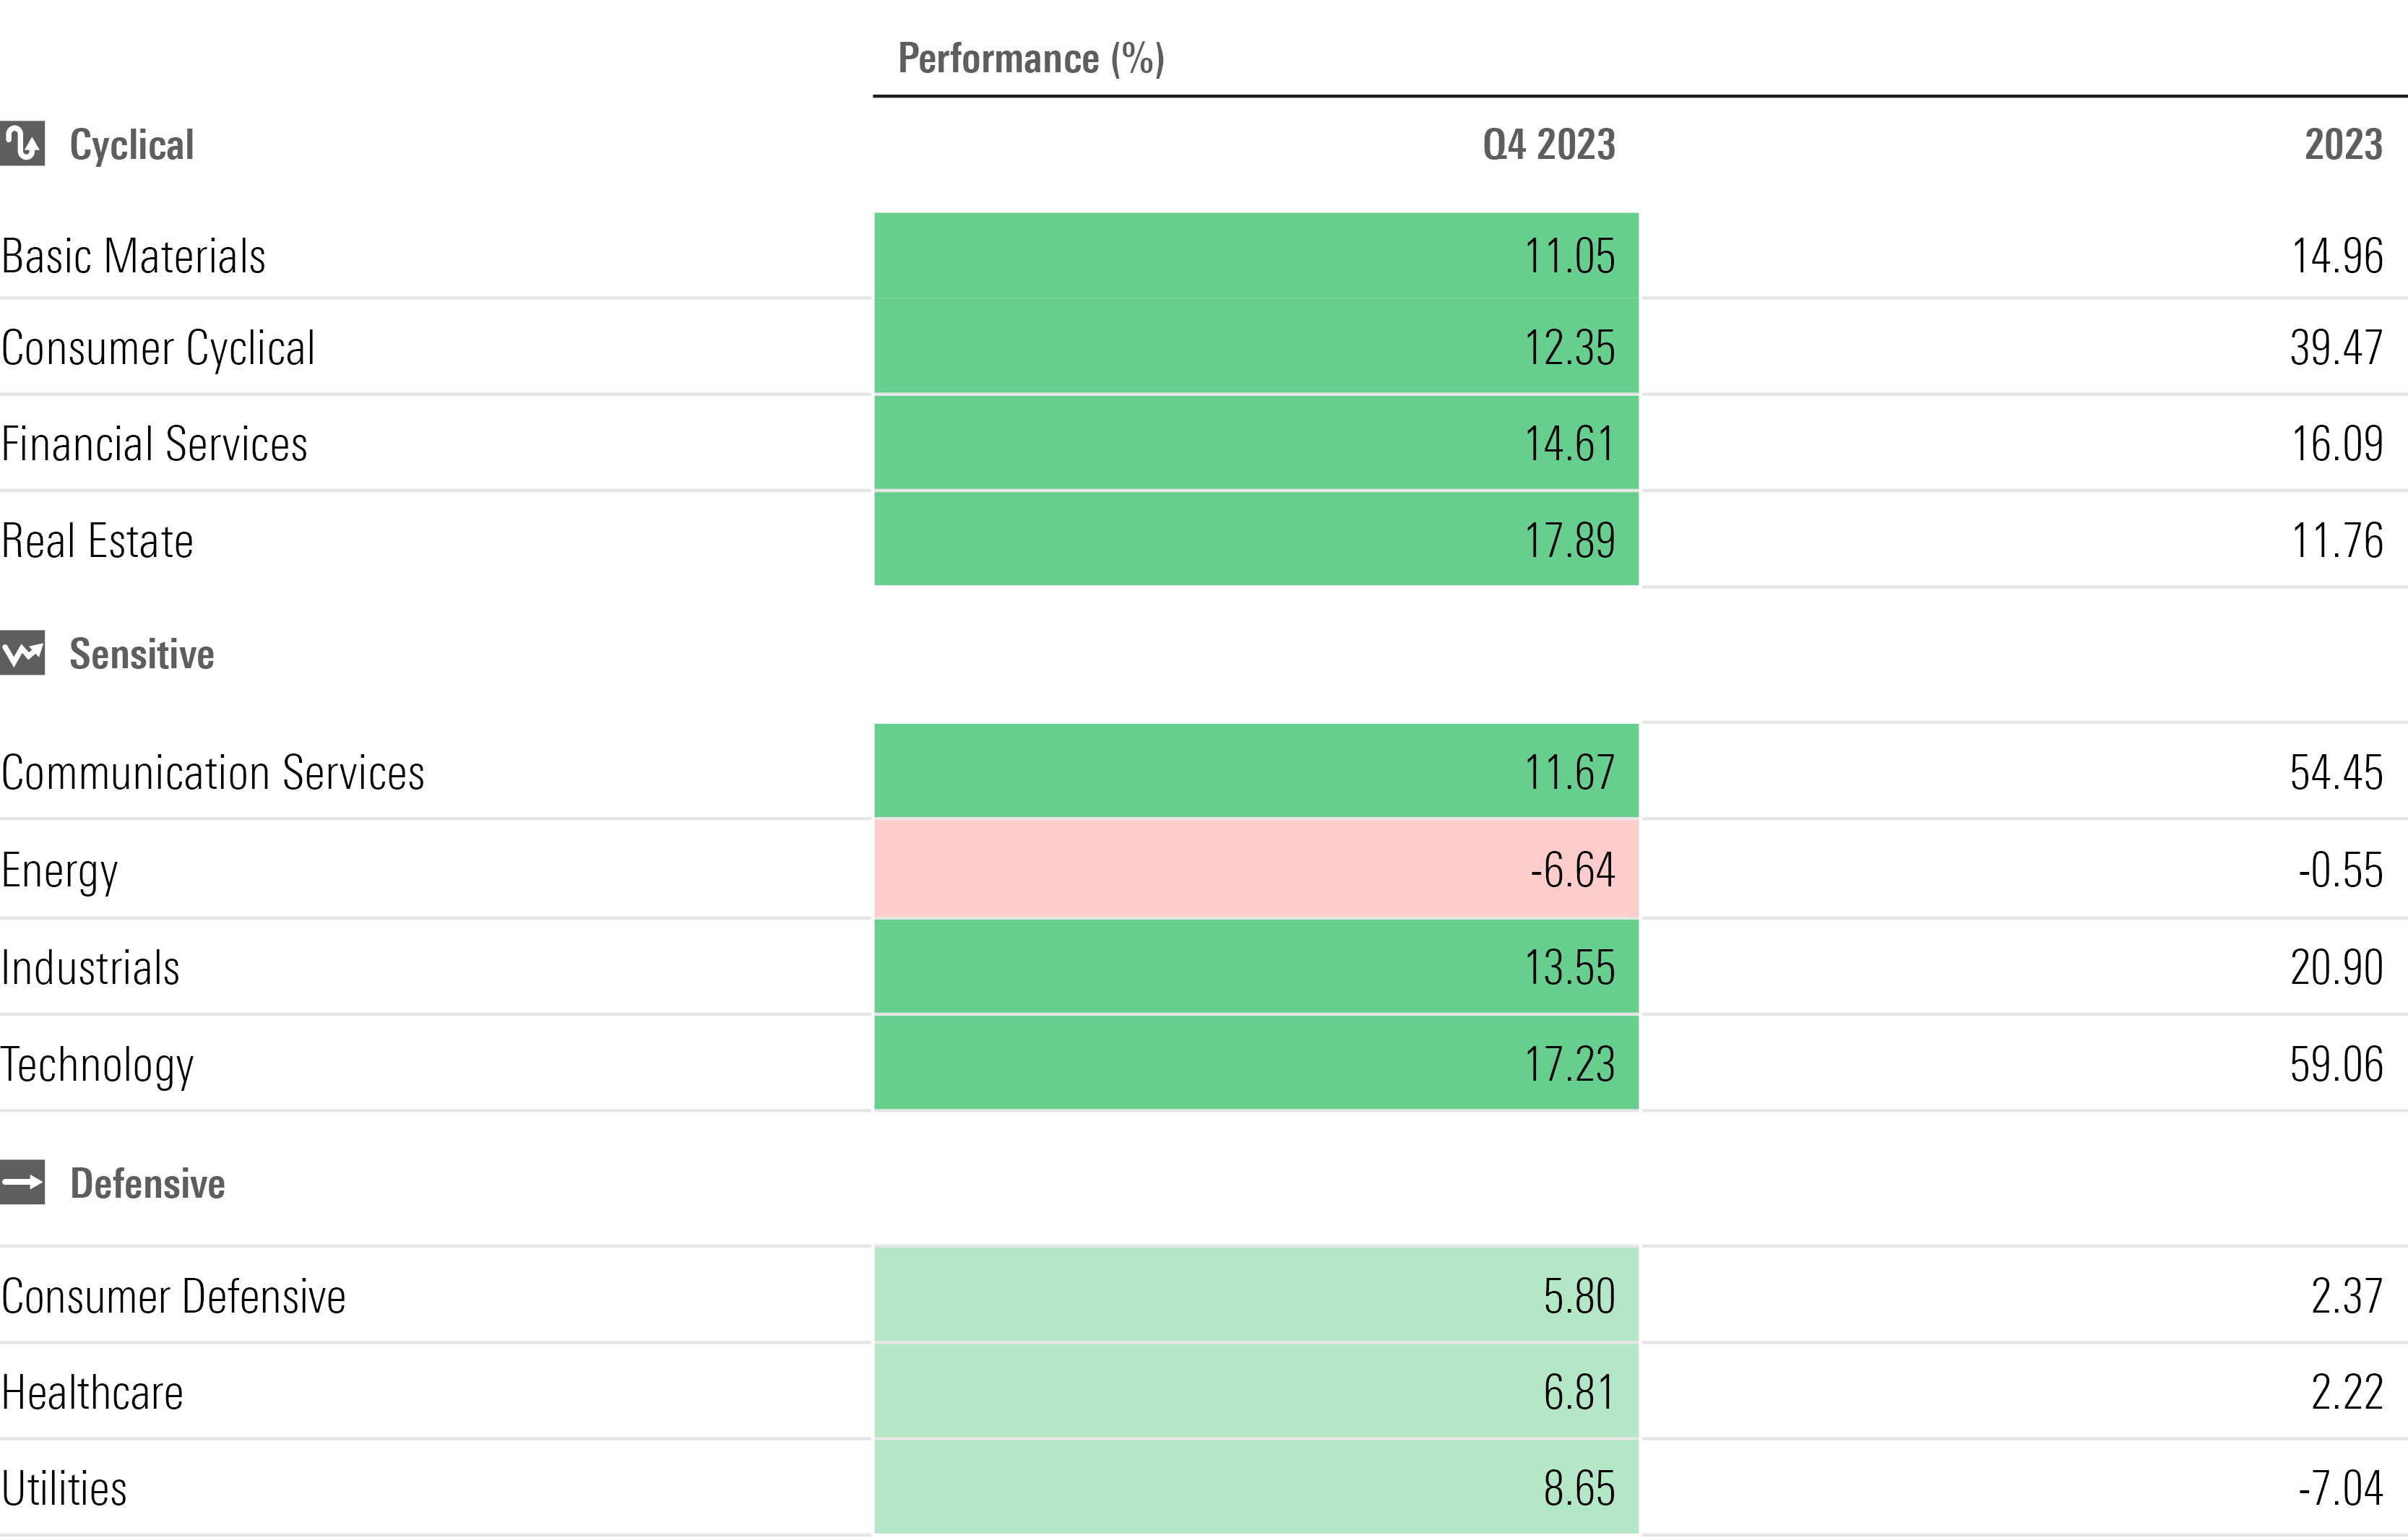
- Technology stocks posted a huge year, surging 59.1% for their best performance since 2009. Along with Nvidia, chip manufacturer Advanced Micro Devices (AMD) jumped 128%;
- Communications Services ranked second among stock sectors, gaining 54.5%, led by rallies in Alphabet (GOOGL), Meta Platforms (META), and Netflix (NFLX);
- The so-called "Magnificent Seven" stocks contributed nearly half of the stock market’s overall gain;
- Large-growth stocks gained 47.3%, blowing away large-value stocks by 36 percentage points – the second-biggest advantage for growth in 25 years;
- Utilities stocks stumbled, losing 7% – their worst year since 2008—dragged down by higher interest rates;
- Dividend stocks lagged the broader market. The Morningstar US Dividend Composite Index rose 11%;
- Volatility remained very high in bonds, with some parts of the bond market staging a round trip over the year. The yield on the U.S. Treasury 10-year note started and finished 2023 near 3.8%, but during the year rose to a 17-year high near 5%;
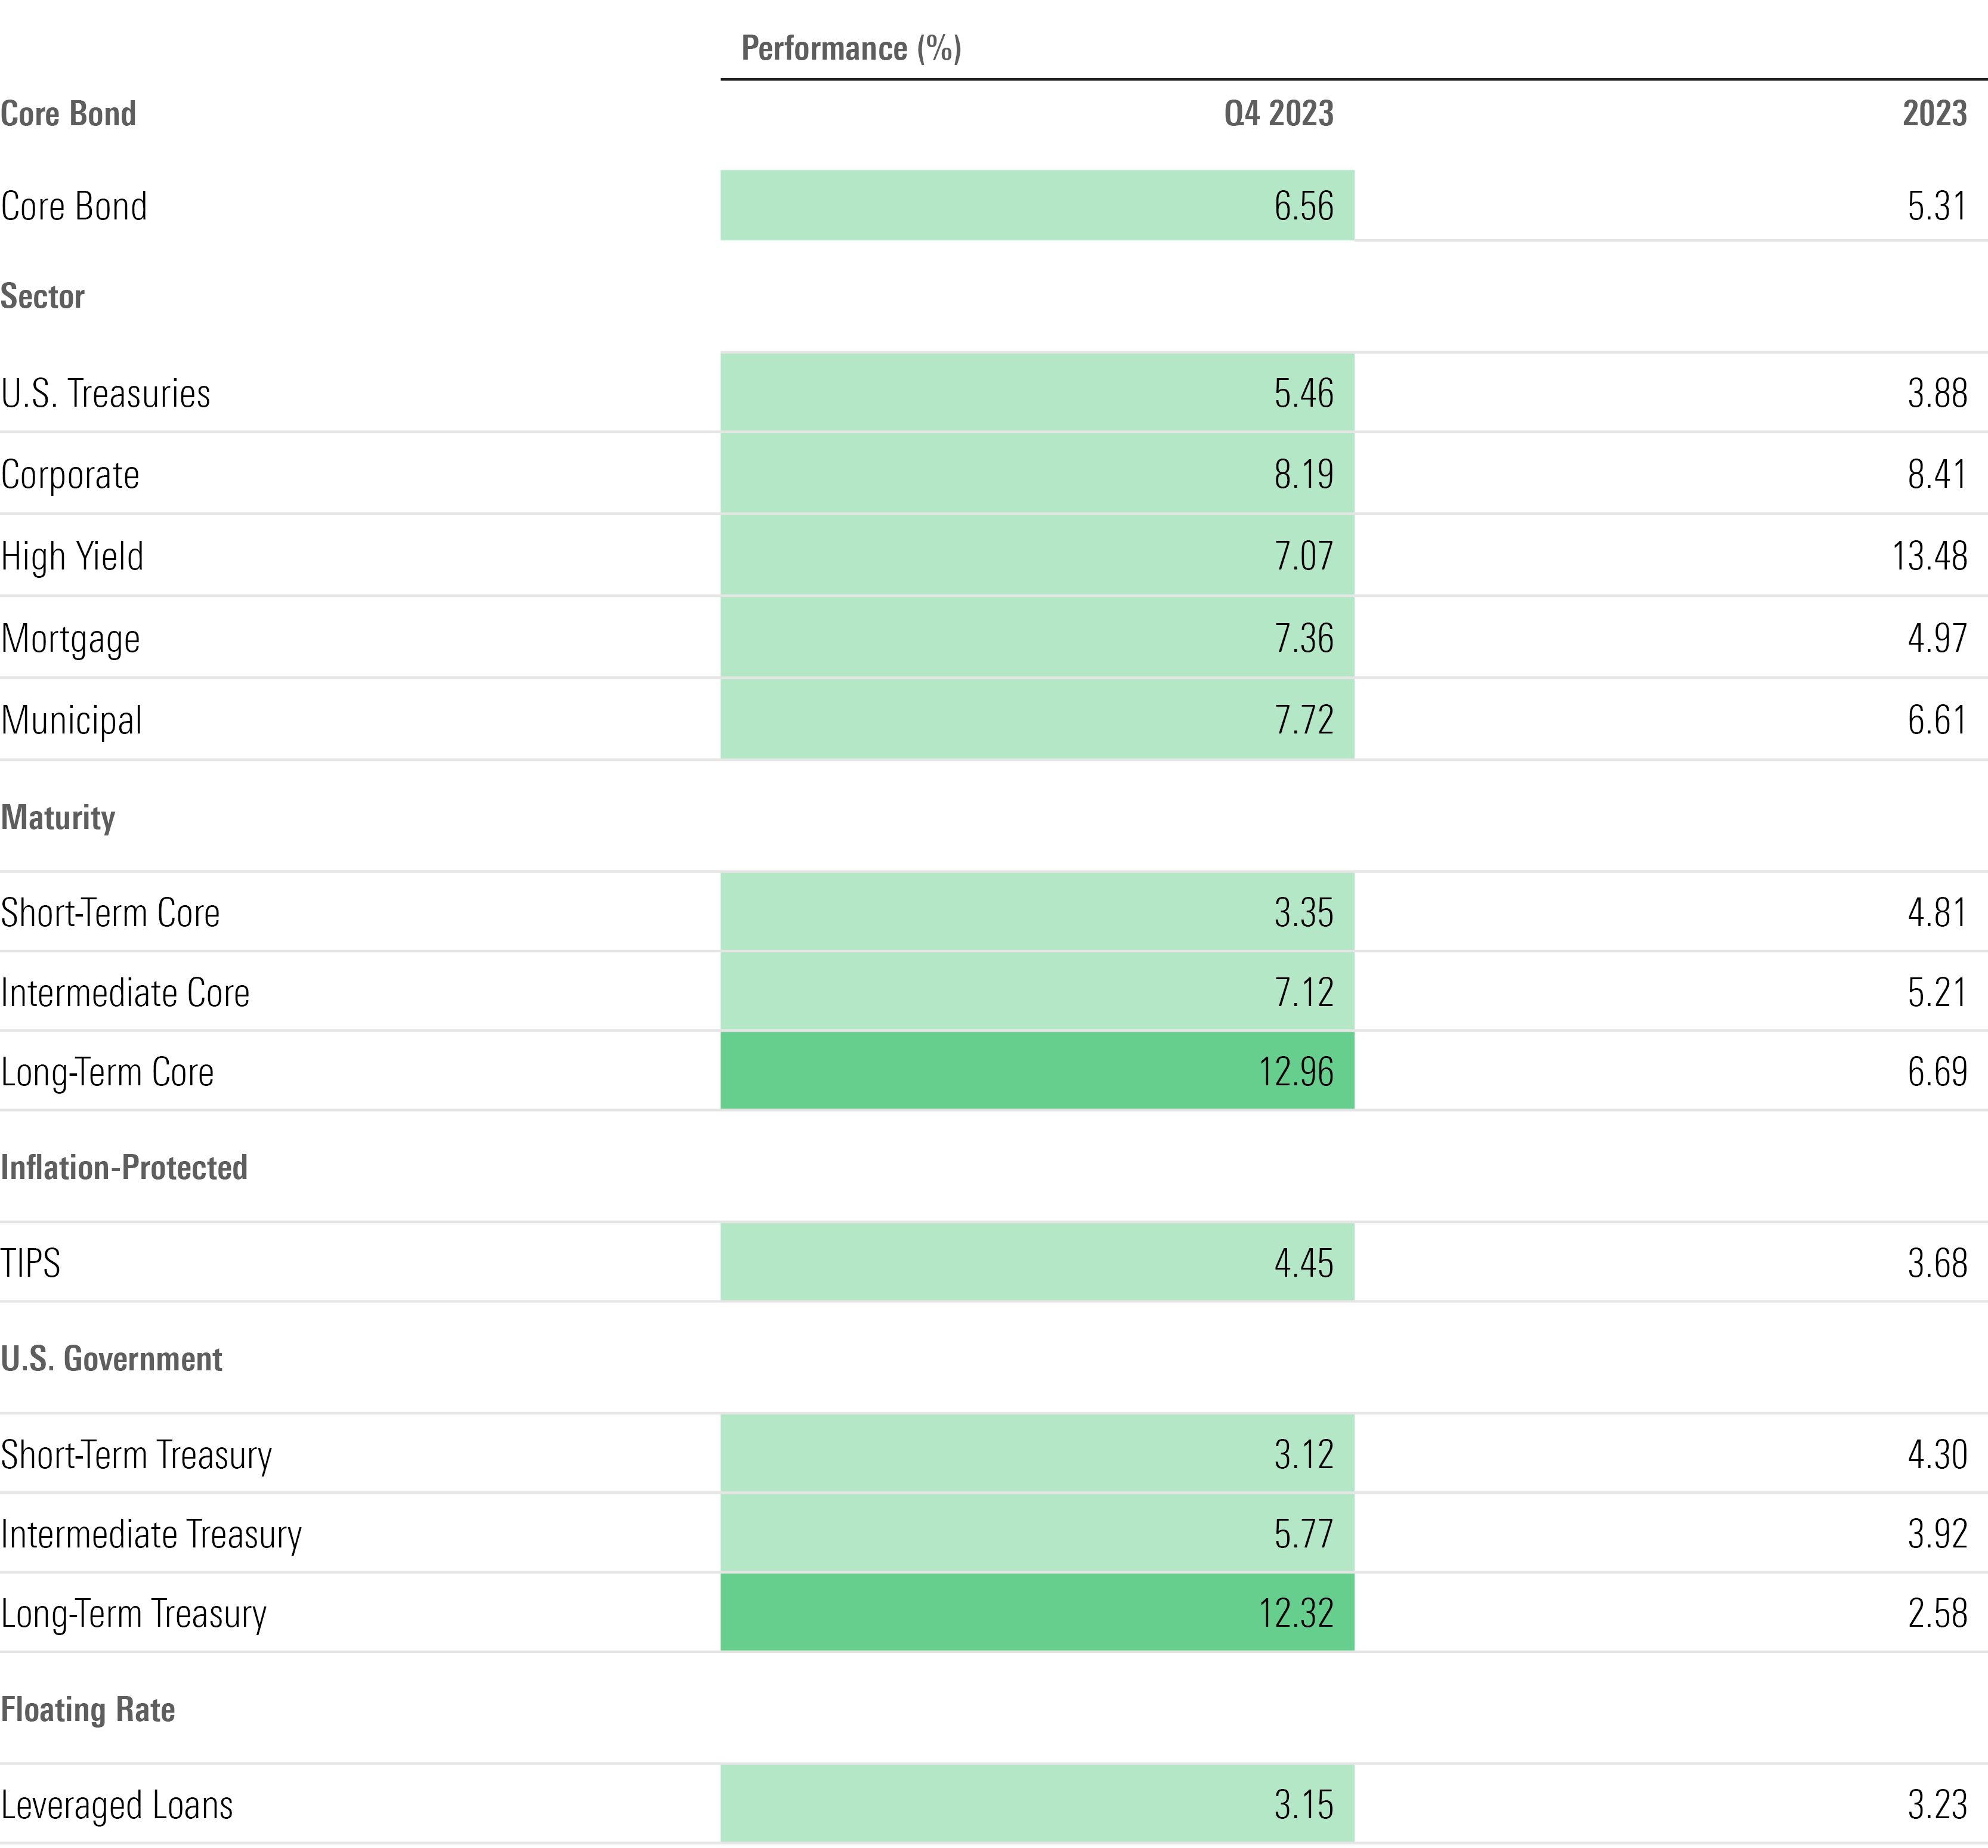
- Credit-sensitive corners of the bond market performed strongly as the economy avoided recession. High-yield bonds gained 13.5%, making for their best year since 2019.
2023 Stock Market Performance
Heading into 2023, there was budding optimism the worst was over for the stock market after it hit what appeared to be bear-market lows in October 2022. However, with inflation still at lofty levels and the Fed still actively raising interest rates, caution continued to dominate. For stock investors in particular, there were widespread concerns that the economy would slide into a recession in 2023.
Those fears took on new life in March following the collapses of Silicon Valley Bank, Signature Bank, and First Republic Bank. These failures, which stemmed from huge losses the banks suffered in holdings of government bonds, sparked fears of a full-blown regional banking crisis and the potential for a credit crunch that could tip the economy into a decline.
But with the Fed stepping in quickly to ease the pressure on regional banks holding troubled bond portfolios, confidence quickly returned to the stock market.
At the same time, enthusiasm bubbled over around technology stocks in the wake of Nvidia’s blowout first-quarter earnings report in May. The key driver was the booming business of supplying chips for AI development.
Bolstering the outlook for equities was surprisingly strong job growth. As the year wore on, concerns about a recession dwindled. Meanwhile, corporate earnings, which started 2023 in a slump, also showed signs of health.
However, many investors remained wary of the market’s rally, in part because it was so heavily concentrated in just a handful of names, specifically the so-called "Magnificent Seven." As of the end of May, nearly all the market’s gains came from the 10 largest stocks.
Still, in June stocks crossed into new bull market territory, gaining 20% from the bear market low. By the end of July, the US Market Index was up nearly 28% from October 2022 and 20% since the start of 2023.
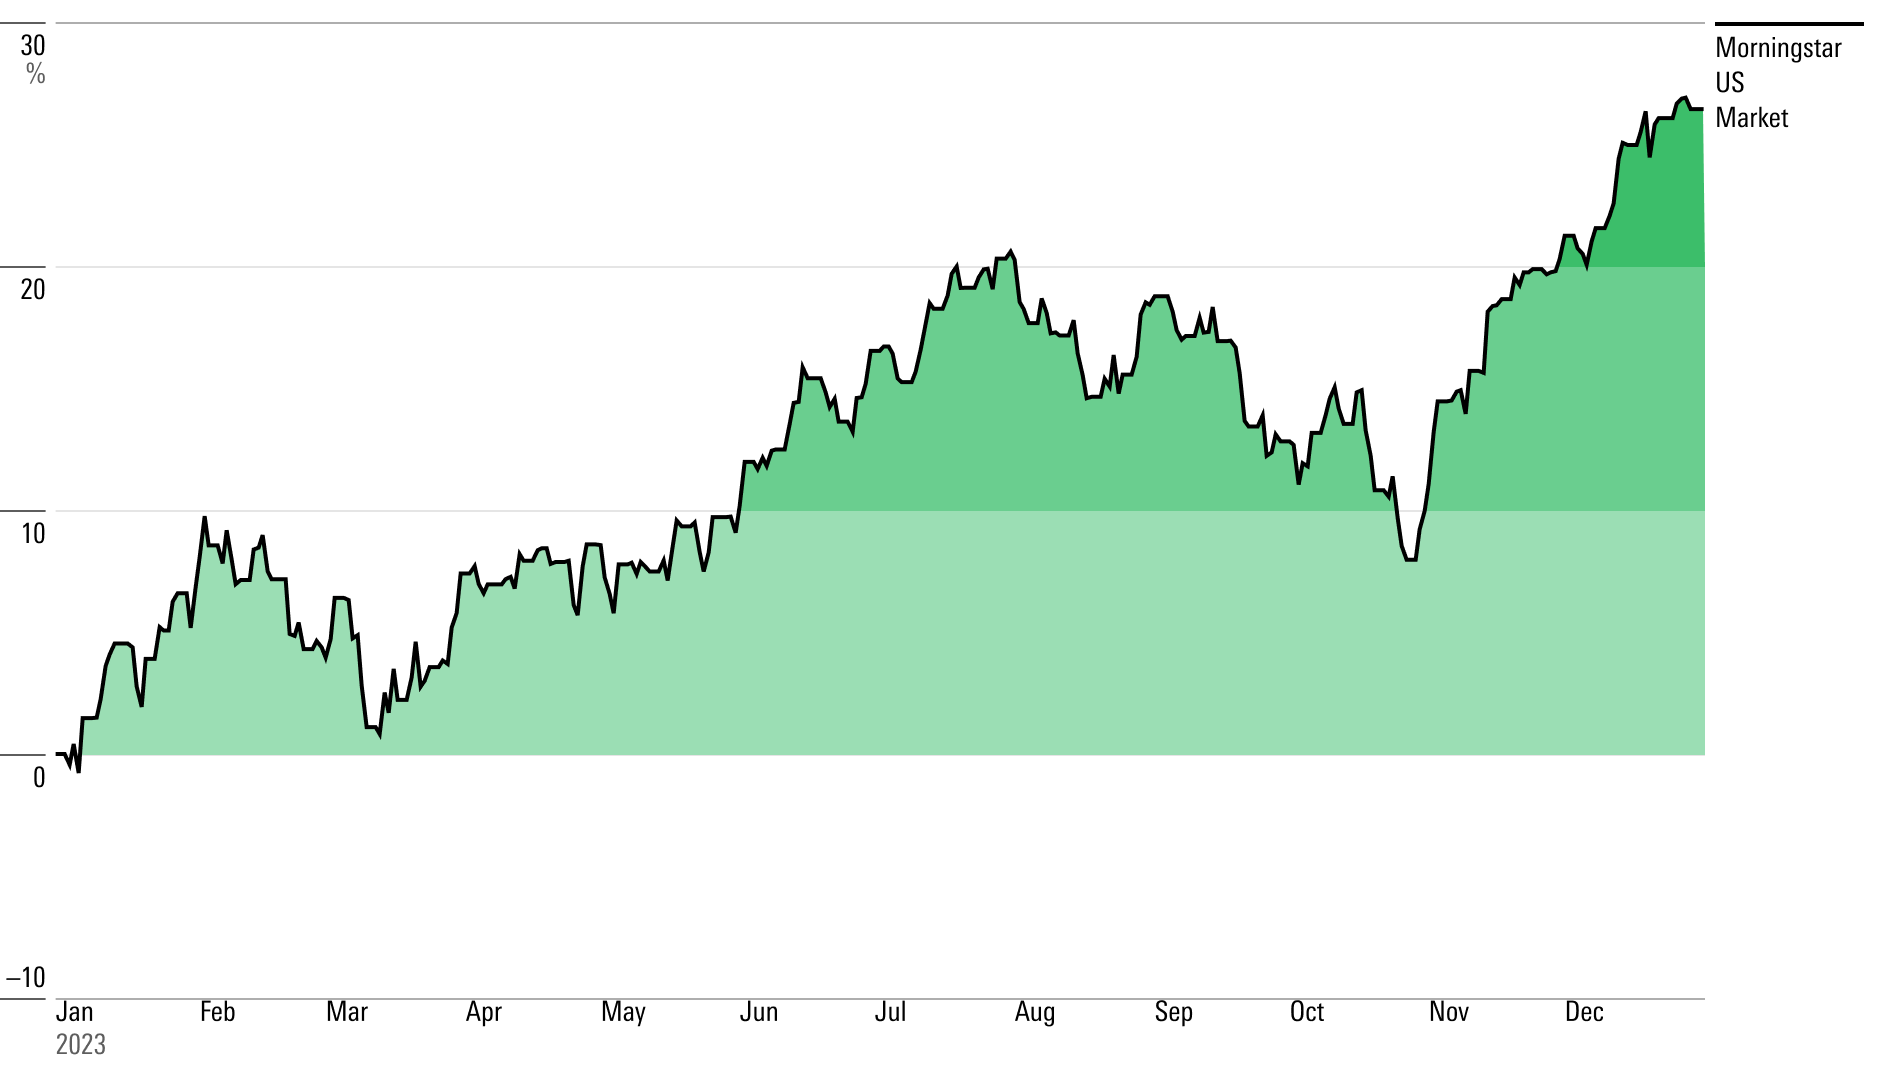
Stocks then ran into an unexpected air pocket in the form of a sudden sharp sell-off in the bond market which saw the yield on the US Treasury 10-year note jump to a 17-year high near 5%. Between July 31 and Oct. 27, the US Market Index fell just over 10%, entering formal correction territory.
But once more, sentiment reversed, this time as evidence accumulated that not only was inflation continuing to trend lower, but that job growth was also moderating. Expectations began to build that the Fed had raised interest rates for the last time at its July meeting and that it would soon shift to rate cuts. By the time the Fed signaled its pivot toward cutting rates in 2024, stocks were well on their way to a 17% rally from October lows, and the market finished 2023 at its highs for the year.
2023 Stock Sector Performance
When it came to the various stock sectors, the primary theme of 2023 was "a reversal of fortune."
Sectors that had been the most buoyant during the bear market lagged significantly in 2023, while those that took the biggest beating in 2022 roared ahead with big gains.
That was especially the case for technology stocks and the communications services sector, which saw big rallies north of 50% in 2023. Contrast that with 2022, when the Morningstar US Communications Services Index was the worst-performing sector benchmark, losing 40.9%. The Morningstar US Technology Index had placed third with a 31.6% drop, behind the 35.5% loss in the Morningstar US Consumer Cyclical Index.
Powering the gains in the tech and communications services sectors (along with the jump in the consumer cyclical sector) were the Magnificent Seven. The group comprises Nvidia, Tesla (TSLA), Meta, Apple (AAPL), Amazon.com (AMZN), Microsoft (MSFT), and Alphabet.
Even Apple, the worst performer of the group, posted gains more than 20 percentage points ahead of the broader market. However, thanks to the big rally, technology stocks are now the most expensive sector, based on Morningstar analysts' fair value estimates.
In the final months of the year, the market's rally did broaden beyond the Magnificent Seven. However, this small group of stocks was still responsible for 47.8% of the US Market Index's 26.5% gain.
On the other side of the fence, 2022's leaders were left in the dust in 2023. The biggest performance differential came among energy stocks. The Morningstar US Energy Index surged 62.5% in 2022, but in 2023, the sector barely held in positive territory as oil prices slid. While many energy stocks had pushed into overvalued territory as a result of the 2022 rally, the sector is now broadly undervalued.
Utilities struggled too, mainly because of rising interest rates, which lifts their cost of capital and offers competition in the form of higher bond yields. Before rallying off their worst levels, the sector overall was at its cheapest level since 2008, according to Morningstar analysts. Now the group is more fairly valued, but dividend yields are still seen as attractive.
Value Stocks vs. Growth Stocks
Along with the massive rally in tech and communications services stocks, growth stocks more broadly put in their strongest performance in 25 years. One catalyst was the shifting outlook for interest rates. The valuations for growth stocks are highly dependent on the value investors attach to future earnings. As a result, rising rates drag on growth stocks because they make those future earnings less valuable.
But with the Fed now expected to cut rates in 2024, that headwind has been reduced. The resulting rally led the Morningstar US Large Growth Index to its biggest gain since 1998, one which outperformed the Morningstar US Large Value Index by 35 parentage points, which is the second-largest margin of the past decade, coming in just behind 2020's returns.
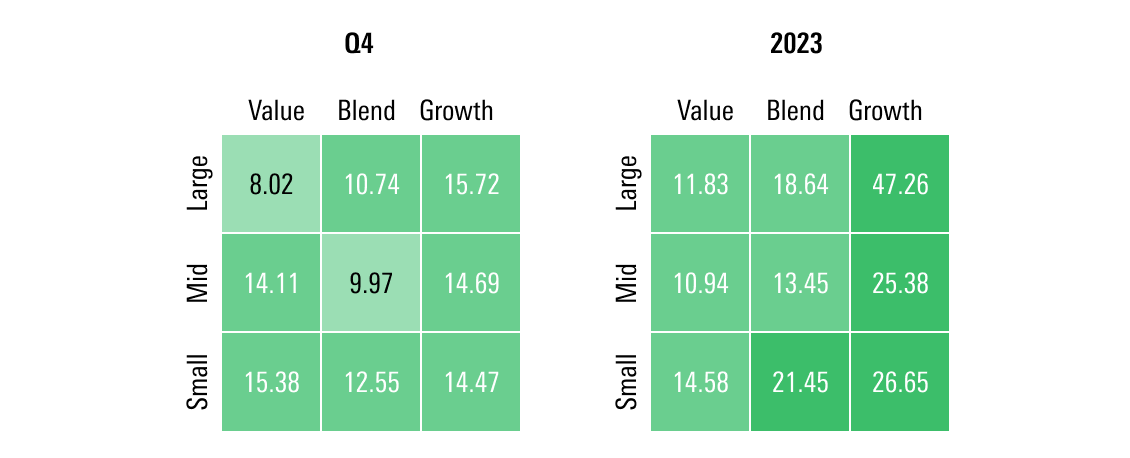
For most of 2023, the stock market's rally was dominated by large-cap stocks, as smaller stocks were held back by fears of recession and higher interest rates. Small value in particular lagged for the first three quarters of the year.
However, with the economy holding strong, as the Fed signaled its shift toward expecting cut rates, small-company stocks staged big gains in the final two months of the year. During the fourth quarter, the Morningstar Small Value Index posted its best quarterly gains since the first three months of 2021.
Dividend Stock Performance
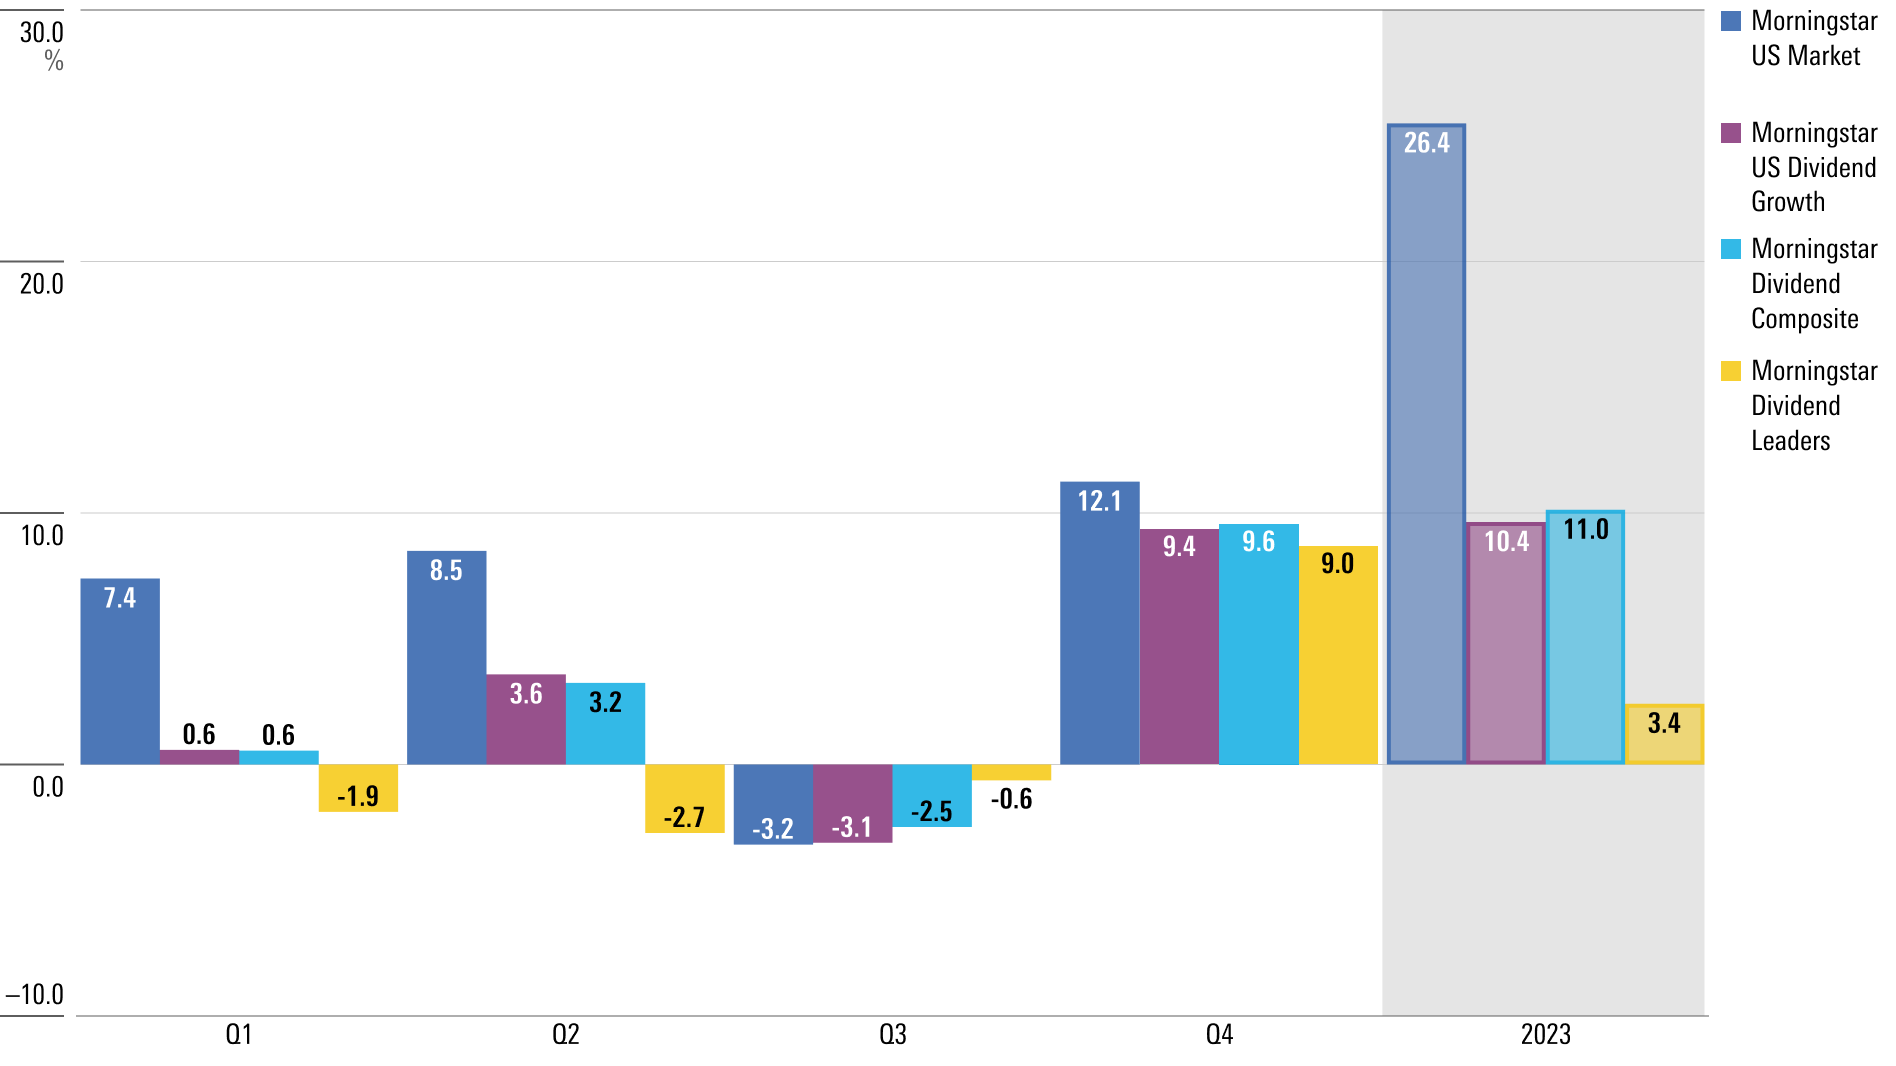
For dividend stocks, the story was one of multiple headwinds coming together to depress performance. The regional banking crisis took its toll, thanks to heavy bias among dividend strategies toward financials. Bigger holdings of energy stocks and utilities also were a drag on performance.
The Morningstar Dividend Composite Index – a broad measure of dividend stock performance – fared best among Morningstar’s main dividend benchmarks, thanks to a relatively heavy weighting in technology stocks, at nearly 18% of the portfolio. (The Morningstar US Market Index is nearly 30% tech stocks.)
In contrast, the Morningstar Dividend Leaders Index – a collection of the 100 most consistently paying, highest-yielding stocks – has just 5% of its weight in tech stocks. That index brought up the rear in 2023, failing to crack even a 4% return for the year.
The Fed and Bond Yields
Far and away, the biggest story for the markets in 2023 was Fed policy. But as is often the case, it was more about investor expectations than what the Fed actually did.
As the year got underway, the Fed shifted from its unprecedented series of three-quarter-of-a-percent increases in its federal-funds rate target range during 2022 to more traditional quarter-point moves. By May, the Fed had raised three times that year, taking that target range to 5.00%-5.25%. When officials met in mid-June, officials held policy steady for the first time since the hiking cycle began in March 2022. However, Fed officials stressed that "higher for longer" was the likely course for interest rates.
In the background, inflation was still elevated and job gains were strong, but with rates having been raised aggressively, officials signaled a desire to give tighter policy a chance to work. The Fed raised rates again in July, taking the funds rate target range to 5.25%-5.50%.
In the bond market, yields followed an arc sharply higher and then lower over the year, in what turned out to be a round trip for some parts of the US Treasuries market.
The yield on the US Treasury 10-year note (which serves as a key benchmark for most home mortgages and other consumer and business loans) started the year near 3.8%, and for the first seven months of 2023, it bounced back and forth within a relatively tight range.
However, in early August, Treasury bond yields spiked in response to news that the federal government had a larger-than-expected need to borrow money through bond sales in the third quarter, rumblings of higher rates in Japan, and data showing a red-hot jobs market. This sent the yield on the 10-year note to a 17-year high of roughly 5% from just below 4% on July 31.
Then, just as quickly, that sell-off was reversed as data showed the jobs market was finally moderating from the pace of hiring seen for most of the year. In addition, inflation news continued to be favorable. When the Fed confirmed it expected to pivot to rate cuts in 2024, bonds rallied strongly.
Treasury Yield Curve Inversion
Another aspect of the market that looks strikingly similar at year-end to the way it did at the start is the inverted US Treasury yield curve.
When short-term Treasury yields exceed long-term yields, it's known as an inverted yield curve, and this is widely seen as a precursor to a recession. (Not all yield curve inversions lead to recessions, but, historically, all recessions have been preceded by one.) Many analysts say the longer the yield curve remains inverted, the more likely a recession becomes.
The yield curve, as measured by the gap between yields on the Treasury 2-year and 10-year notes, has been steadily inverted since July 2022. This was the result of the Fed’s aggressive effort to raise the federal-funds rate, which lifted short-term yields well above long-term yields.
Looking at recent history, this 17-month inversion is second in length only to the period of August 1978 through April 1980, which ended while the economy was in recession.
Over 2023, the extent of the inversion has swung widely. To start the year, 2-year notes yielded about 0.5 percentage points above the 10-year note. Twice during the year, that gap widened to roughly a full percentage point, which by historical standards is an extremely large difference. During the bond market sell-off in October, the yield curve flattened out toward a 0.2-percentage-point difference for 2-year notes over 10-year notes. By year-end, the yield curve was inverted by roughly 0.4 percentage points.
2023 Bond Market Performance
While most of the attention was on the Fed's plans for interest rates and the wild swings in long-term Treasury bond yields, when it came to actual returns, the action was elsewhere. By far, the best returns came on credit-sensitive portions of the bond market.
Several factors boosted returns on the credit markets. The first was the unexpected strength of the economy. As the year wore on and it became clearer that we would avoid recession, that lessened the perceived risks of default on bonds issued by riskier borrowers.
Second, many lower-quality borrowers had taken advantage of the long period of extremely low interest rates to issue longer-maturity debt. That meant that even with interest rates higher than they have been in many years, those borrowers weren’t as likely to face a cash crunch brought on by having to issue debt at levels they couldn’t afford.
Meanwhile, the strong gains in the stock market, along with the friendly Fed, engendered a so-called "risk on" mentality, wherein investors were more willing to venture into lower-quality debt.
As a result, for the second year running, leveraged loans were a top-performing group within the bond market. Leverage loans had the benefit of both the favorable backdrop for credit conditions and their historical bias toward performing well in rising rate environments, thanks to the floating-rate nature of the underlying debt.
2023's Best and Worst Market Performers
It was a good year for technology stocks, no matter how you sliced it.
Even when pulling back the lens globally, across asset classes and sectors, technology names (semiconductors in particular) dominated the performance charts in 2023. Driving this rally was the emergence of AI as a transformative technology requiring massive new computing power.
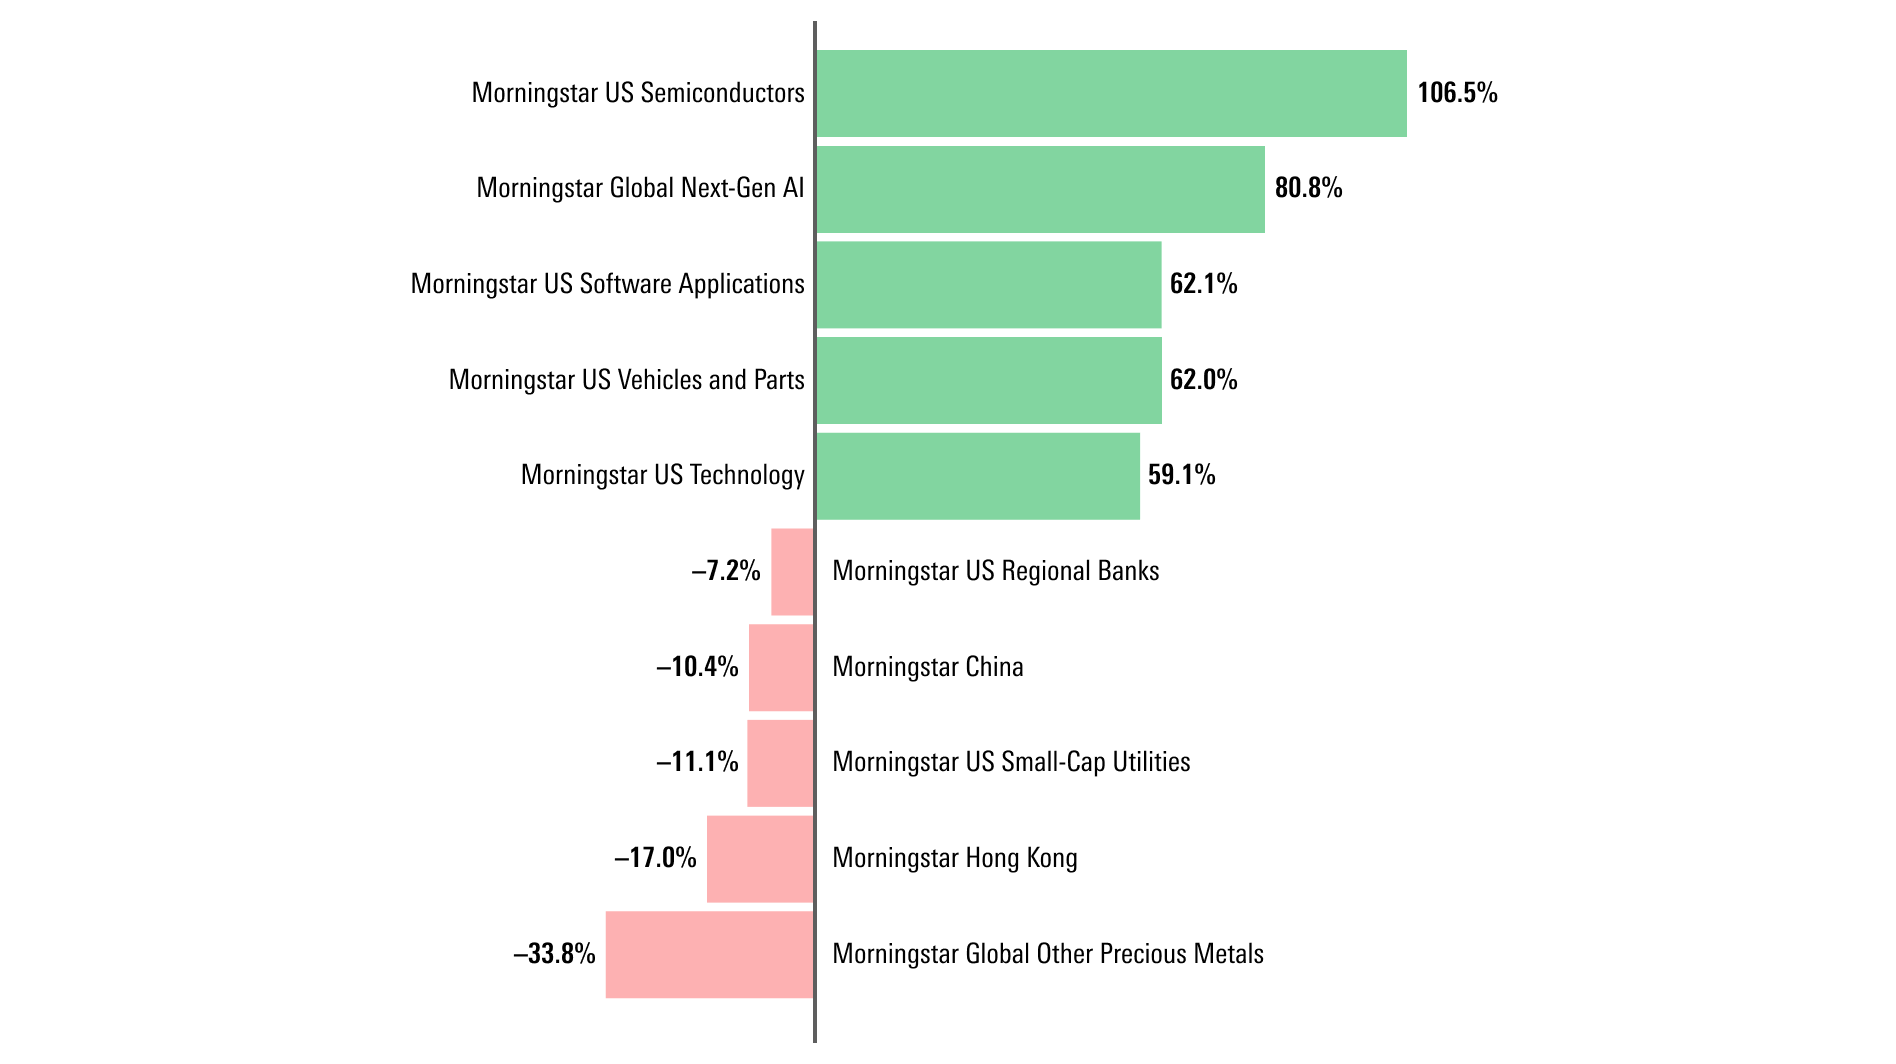
Even as much of the broader stock market marched higher over the year, one group was unable to erase its early massive losses: regional banks.
The Morningstar US Banks-Regional Index was down as much as 36% in May after the collapse of Silicon Valley Bank, and even over the summer it was still posting double-digit losses. It was only with the signals from the Fed that rate cuts could be coming in 2024 – which would relieve the pressure on these banks’ balance sheets – that the index closed its losses to single digits for the year.
Bottom-ranked performers also include China stocks, where equities are posting their third consecutive year of losses. Sentiment among investors has been soured by a combination of slowing economic growth, ongoing financial strains in the country’s real estate sector, and a heightened wariness among some investors about the geopolitical risks involved with owning China stocks.
Stock and Bond Market Volatility
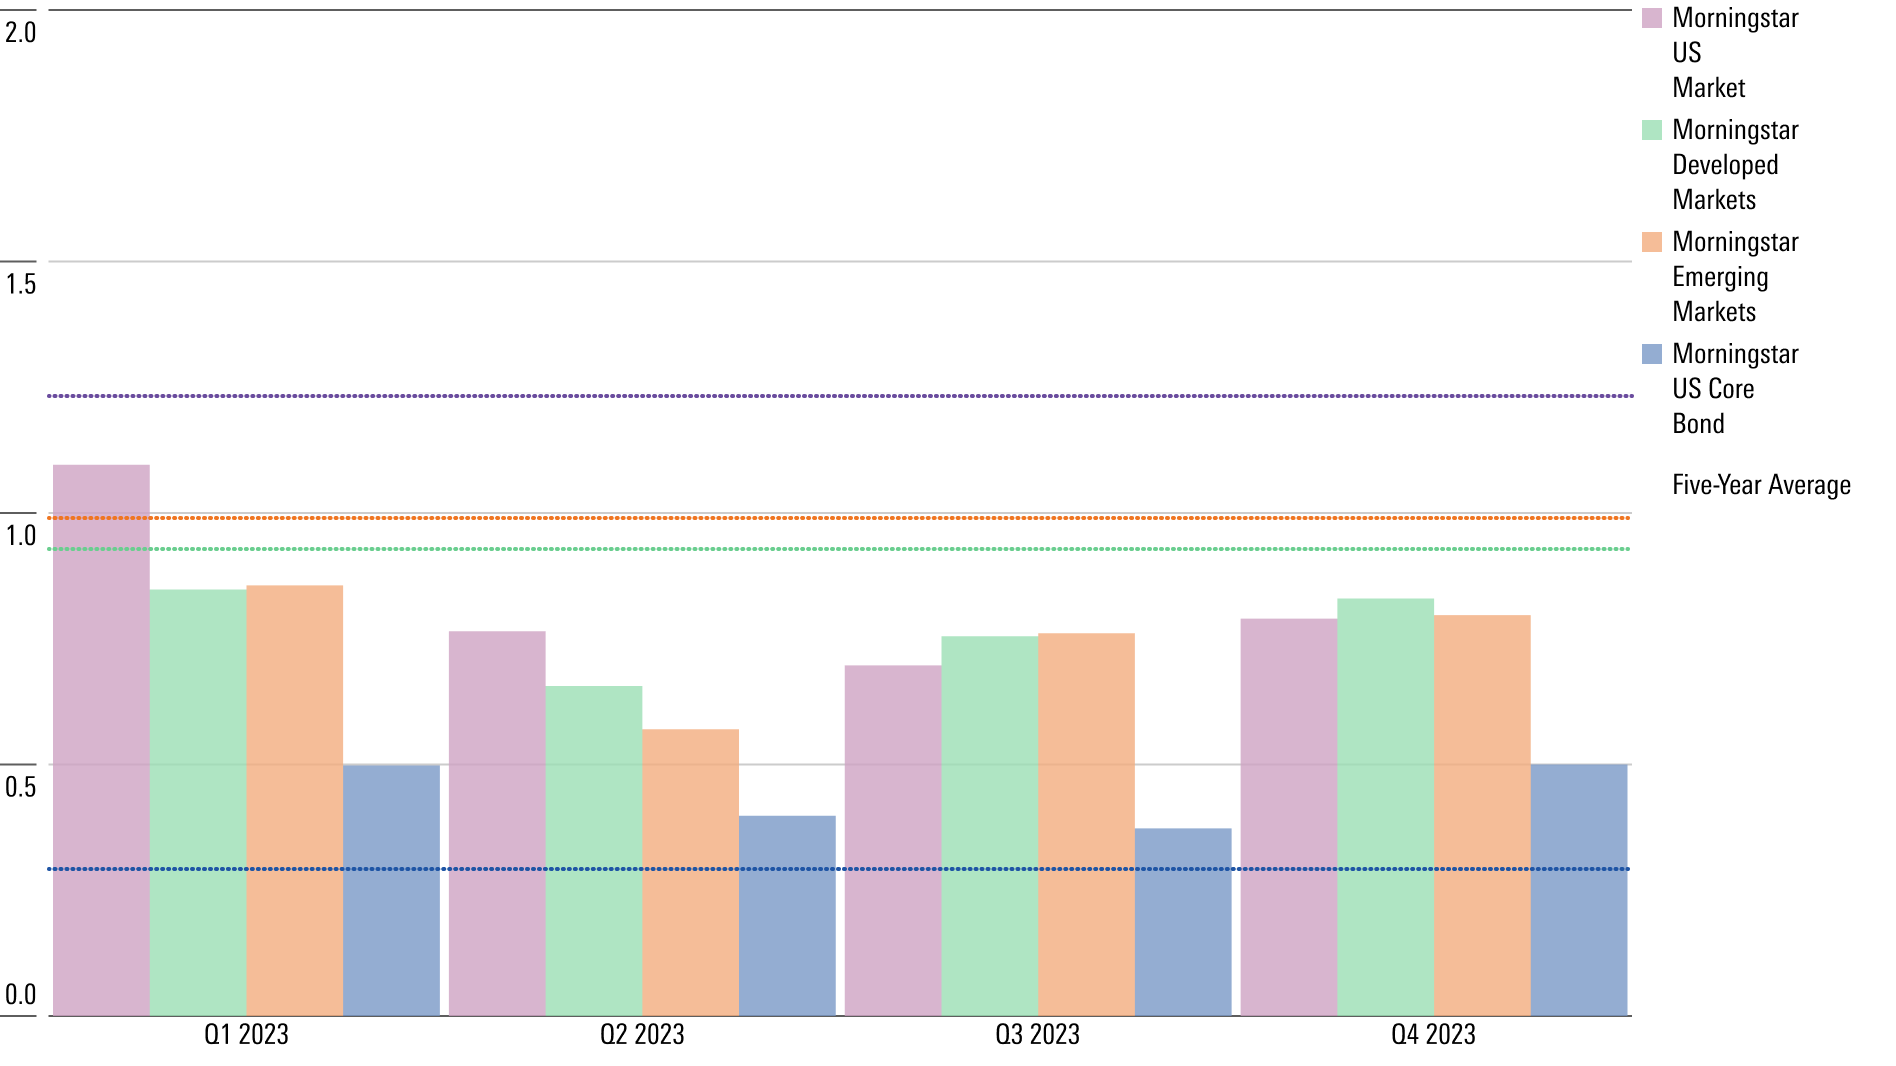
The past year was a reminder that volatility captures both market plunges and big market rallies.
Even as stocks and bonds posted gains for the year, volatility was elevated – especially in the bond market, which saw a tremendous whipsaw in prices during the fourth quarter.
Driving the volatility was the back and forth over the outlook for the Fed. During the fourth quarter, as the Treasury bond market swung from a big sell-off into a sharp rally, volatility jumped to its highest level in at least five years.
2023 Currency Market Performance
For much of the year, the story in the currency markets was the strength of the dollar, especially against the Japanese yen. With the Fed continuing to raise rates and the Bank of Japan doing little more than signaling a slight bias toward higher rates, the dollar gained nearly 16% against the yen by the middle of November. It was only in the final weeks of the year, after the Fed signaled its pivot to lower rates, that the dollar fell back against the yen. Still, the dollar finished 2023 up nearly 8% against the yen.
The greenback also held firm against the euro, with expectations that the European Central Bank will need to cut rates in 2024 largely offsetting similar expectations for the Fed.
2023 Commodity Markets Performance
In commodities, geopolitical risks continued to hover over the oil market, but it was slowing demand that drove prices in the end. Oil prices spiked in October in the wake of the outbreak of war between Israel and Hamas, but quickly fell back. That slump came despite concerns over OPEC output cuts by Russia and Saudi Arabia.
Gold prices ended 2023 near a new record high hit in early December. Driving prices higher have been a combination of concerns about geopolitical risks, such as an expanding war in the Middle East, and the prospects of lower interest rates in the United States.
Meanwhile, copper seesawed in 2023, but it finished the year slightly higher. With copper seen as a reflection of global economic activity, prices have been capped by concerns about the health of the Chinese economy and expectations for slower growth in the U.S. in 2024.
2023 Cryptocurrency Performance
Cryptocurrencies roared back to life in 2023, despite continuing scandals in the industry. Both Bitcoin and Ether lost more than half their value in 2022, but their prospects revived on expectations that the Securities and Exchange Commission is drawing closer to approving exchange-traded funds based on spot cryptocurrency trading.
In addition, both currencies gained in strength as investors viewed the Fed’s expected rate cuts as a positive.
:quality(80)/cloudfront-us-east-1.images.arcpublishing.com/morningstar/5FNGF7SFGFDQVFDUMZJPITL2LM.png)


.png)


